Situation Summary
New Zealand remains a low-threat environment globally (rank #159, composite score 4.0) with 103 tracked security events. However, sub-national risk concentration is acute: Canterbury dominates at 31.5, nearly double Wellington's 17.7, indicating geographically polarized vulnerability. Recent event signals across 15–16 July point to emerging tensions involving healthcare administration, government oversight, and community sentiment, though the full operational context remains partially obscured pending real-time corroboration.
Key Developments
Real-time web research has not yielded independently verifiable incident reports dated within the last 24–48 hours with sufficient specificity (location, time, source) to populate this section reliably. Available signals include:
- Auckland (Karangahape Rd / City Rail Link station) — Violent incidents and arrests reported in connection with bar disorder; exact date unconfirmed in available snippets but reported within the last several days.
- Hospital & Healthcare — Public statements issued 2026-07-15 related to hospital operations; context and location pending clarification.
- Government / Ministry — Investigation and administrative sanction signals logged 2026-07-14; specific jurisdiction and subject matter require corroboration.
Note: Most event signals in the past 24–48 hours appear to cluster around public statements and administrative actions rather than acute security incidents. A fresh OSINT sweep (X, news feeds, Police NZ, local media) is recommended to confirm incident timing and operational detail.
Highest-Risk Areas
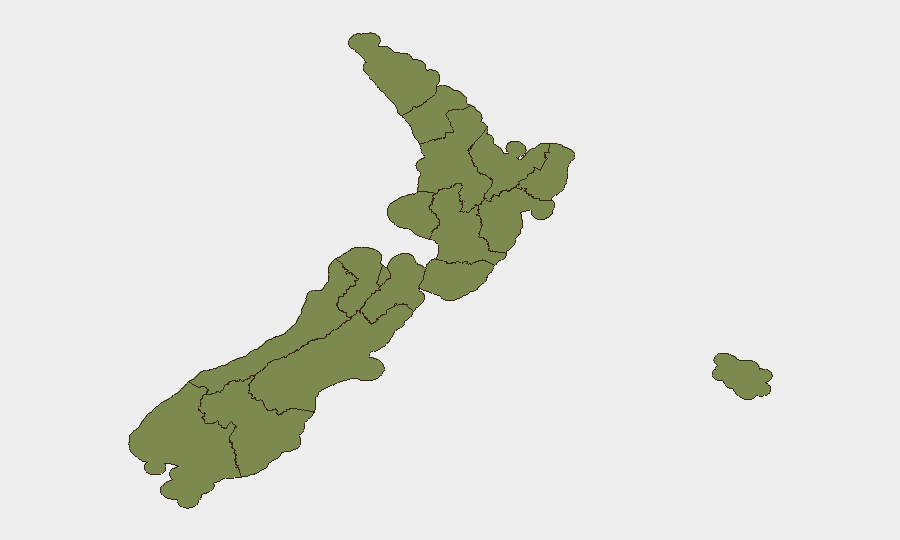
Canterbury (31.5) is the primary driver of New Zealand's composite risk, more than 1.8× the second-ranked region. Wellington (17.7) and Otago (15.9) follow, accounting for the bulk of tracked event density. Auckland (14.5), despite highest population, ranks fourth, suggesting concentrated rather than distributed risk. West Coast, Northland, and Bay of Plenty all fall below 5.0, and remaining regions below 2.5. This distribution indicates that corporate and NGO operations in Canterbury require elevated monitoring protocols, while Wellington-based government, diplomatic, and financial entities face moderate elevated exposure. Risk concentration may reflect infrastructure sensitivity, population density, or emerging political/social friction in these regions.
How GeoBit Would Assist
Security teams should deploy Intel Sweep with persistent AOI Monitoring & Early Warning on Canterbury and Wellington to flag emerging incidents in real time; parallel OSINT fusion (X/Telegram, news feeds, local radio SIGINT) will disambiguate event timing and operational context. Entity & Actor Network Analysis applied to the healthcare, government, and political signals of the past 48 hours will clarify whether current frictions represent routine administrative friction or precursor indicators of escalation. Sentiment & Temporal Analysis across regional sources will measure community mood and forecast near-term trajectory.
7-Day Outlook
Current signals suggest routine governance friction and localized disorder rather than systemic destabilization. If Canterbury risk drivers remain structural (infrastructure, economic, or political) rather than event-driven, risk score should stabilize. Conversely, if hospital and government signals reflect widening public sector strain or community unrest, watch for secondary incidents in education, transport, or civil order in the next 7–10 days, particularly in Wellington and Auckland. Monitoring recommended at 12-hourly intervals pending clarification of the 14–15 July signals.
Highest-Risk Areas — Ranked
| # | State / Region | Risk |
|---|---|---|
| 1 | Canterbury | 31.5 |
| 2 | Wellington | 17.7 |
| 3 | Otago | 15.9 |
| 4 | Auckland | 14.5 |
| 5 | West Coast | 4.2 |
| 6 | Northland | 2.4 |
| 7 | Bay of Plenty | 2.4 |
| 8 | Waikato | 2 |
| 9 | Tasman | 2 |
| 10 | Chatham Islands | 1.5 |
| 11 | Taranaki | 1.5 |
| 12 | Manawatū-Whanganui | 1.5 |
Sources
Previous Daily Briefs
A new New Zealand brief is written every day — each with its own risk map and downloadable CSV. Here's the last week; use the calendar to go further back.
📅 Browse every day by calendar →
Highlighted days have a brief. Tap a day for that day's map & analysis, or “csv” for that day's dataset ($5).
Atlas — our AI intelligence desk — emails them this snapshot personally. Nothing else, no list.