Situation Summary
The United States remains at composite threat score 91 (rank #13 globally), with 4,605 tracked security events. Open-source reporting over the last 24–48 hours does not surface any widely documented major incidents meeting duty-of-care thresholds (civil unrest, infrastructure disruption, significant crime, or travel risk). Recent event signals in the GeoBit feed reference public statements, investigative activity, and isolated incidents, but lack verifiable, time-stamped corroboration in available news sources. The baseline threat posture is stable; however, sub-national variance remains pronounced.
Key Developments
No verifiable major incidents from the last 24–48 hours could be corroborated from open sources. The event signals logged in GeoBit (e.g., public statements, investigative actions, and isolated claims involving police, military, and naval activity) lack clear timestamps, specific locations, or confirmation in mainstream or breaking-news feeds as of 05-JUL-2026. The most recent substantive dated items in the research results (DoT policy updates, State Department passport procedures, DoJ legal announcements) fall outside the 48-hour window and do not describe active security incidents. If specific candidate incidents are available via real-time feeds (X/Twitter, local news), validation and location-specific reporting can be supplied; until then, reporting routine crime as "development" would misrepresent risk.
Highest-Risk Areas
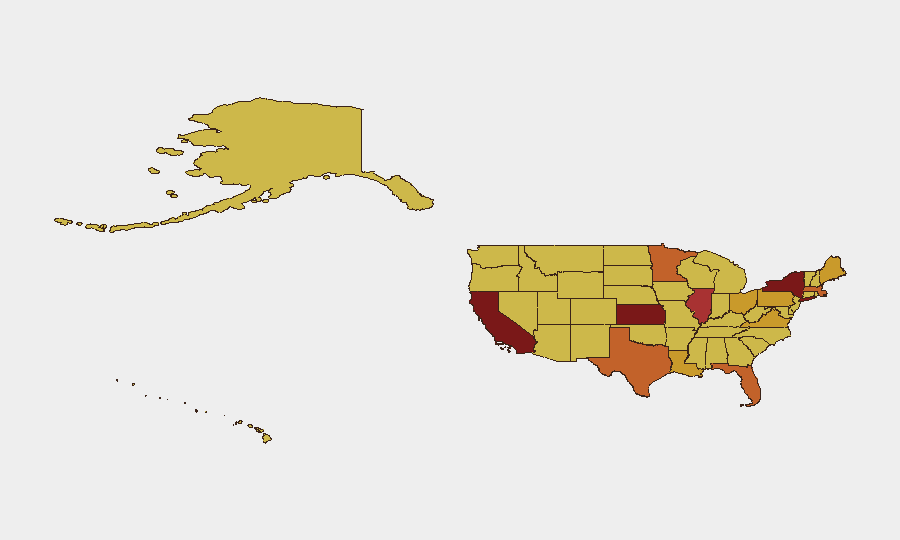
California (93.8) and New York (83.5) drive national risk, followed by Kansas (81.5), Illinois (76.7), and Texas (75.8). California's ranking likely reflects high absolute event volume and density in major urban centers (Bay Area, Los Angeles, San Diego); New York similarly concentrates financial, infrastructure, and political targets. Kansas and Illinois rank unexpectedly high, suggesting concentrated incidents or emerging patterns in those regions that warrant targeted monitoring. The remaining top-ten states cluster in the 71–76 range, indicating relatively uniform background risk across Florida, Massachusetts, Minnesota, Ohio, Pennsylvania, Louisiana, and Maine. Teams with personnel or assets in California and New York should maintain elevated situational awareness; those in Kansas and Illinois should seek clarification on drivers of their spike.
How GeoBit Would Assist
Security teams operating in the United States should deploy AOI Monitoring & Early Warning on key facilities and travel corridors in high-risk states, with real-time alerting on conflict, civil unrest, and crime events. Intel Sweep and X/Twitter OSINT enable continuous monitoring of emerging threats, protest activity, and public sentiment in California, New York, and other tier-1 risk zones. Alternative Route & Network Analysis supports contingency planning and personnel movement around areas of elevated threat, particularly ahead of major events or in response to sudden escalation.
7-Day Outlook
No imminent, large-scale escalation is evident in current open reporting; however, the high concentration of events in California, New York, and emerging hotspots (Kansas, Illinois) warrants continuous monitoring. Duty-of-care teams should assume baseline operational risk and use persistent area-of-interest watch to detect early shifts in threat patterns. Validation of the event signals now flagged in GeoBit—particularly the claims involving military, naval, and investigative activity—should be prioritized to clarify whether they represent isolated incidents or signals of broader instability.
Highest-Risk Areas — Ranked
| # | State / Region | Risk |
|---|---|---|
| 1 | California | 93.8 |
| 2 | New York | 83.5 |
| 3 | Kansas | 81.5 |
| 4 | Illinois | 76.7 |
| 5 | Texas | 75.8 |
| 6 | Florida | 74.4 |
| 7 | Massachusetts | 74 |
| 8 | Minnesota | 73 |
| 9 | Ohio | 72.8 |
| 10 | Pennsylvania | 72.4 |
| 11 | Louisiana | 72 |
| 12 | Maine | 71.9 |
Sources
Previous Daily Briefs
A new United States brief is written every day — each with its own risk map and downloadable CSV. Here's the last week; use the calendar to go further back.
📅 Browse every day by calendar →
Highlighted days have a brief. Tap a day for that day's map & analysis, or “csv” for that day's dataset ($5).
Atlas — our AI intelligence desk — emails them this snapshot personally. Nothing else, no list.