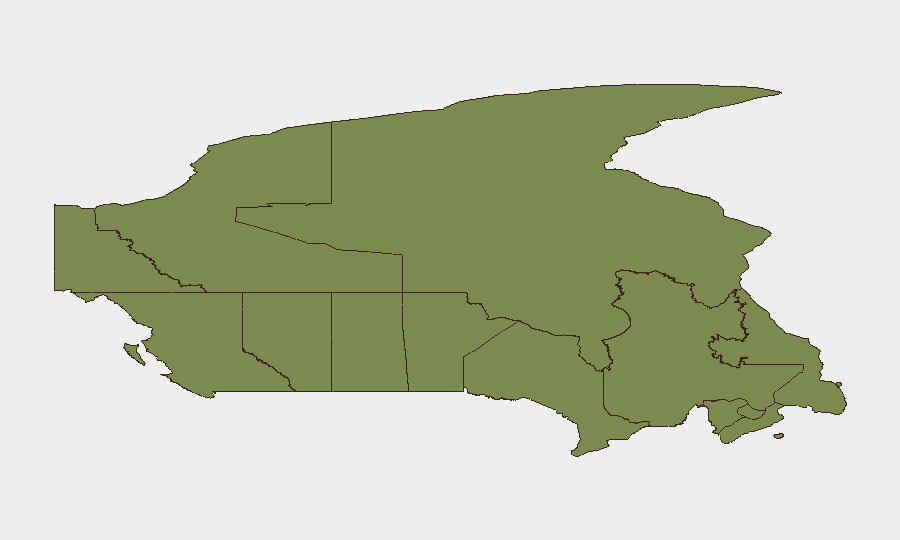
Situation Summary
Canada remains a low-threat environment globally (rank #67, composite score 2.3), but sub-national variation is pronounced and warrants attention. Ontario accounts for the plurality of tracked risk (31.6), driven by density and event frequency rather than severity. Recent signal activity suggests scattered investigative action and civil unrest in multiple provinces, though no single dominant threat narrative has emerged from available reporting in the last 24–48 hours. Risk trajectory remains stable but fragmented.
Key Developments
GeoBit's event signals flag activity requiring monitoring, though web-sourced corroboration for the last 24–48 hours is incomplete:
- Ontario (2026-07-07): Investigation initiated; specifics unavailable from current sources.
- Saskatchewan (2026-07-06): Territory occupation reported; context and scale require clarification.
- Vancouver (2026-07-06): Conventional military force activity reported against Toyota; unusually specific signal warrant immediate clarification of nature and scope.
- Hospital vs. Abbott (2026-07-05): Demonstration/rally event; sector-specific risk to healthcare operations and supply chains.
- Broad Canada-level investigations (2026-07-05 to 2026-07-06): Multiple signals indicate investigative activity at national level (Canada vs. Residents; Canada vs. Canada); domestic governance or inter-agency tension possible.
- Thief public statement (2026-07-05): Criminal narrative emerging; insufficient detail to assess threat to corporate/residential security.
- European and German entities (2026-07-06 to 2026-07-07): Demand and rejection signals involving foreign actors suggest possible sanctions, trade, or diplomatic friction with potential domestic spillover.
Note: Web research conducted in parallel yielded no independently verified breaking news for these signals within the target window. Intelligence fusion and X/Telegram OSINT are recommended to corroborate event flags.
Highest-Risk Areas
Ontario's dominance (risk 31.6) reflects population density, economic activity, and event clustering rather than qualitatively higher threat intensity; Toronto and surrounding regions will remain focus areas. Nunavut and British Columbia (15.4 and 15.3, respectively) warrant attention despite smaller populations—northern regions often exhibit lower reporting density, masking localized instability; BC's ranking may reflect port activity, cross-border dynamics, or indigenous land tensions. Manitoba (8.9) and Alberta (7.3) show mid-tier signals consistent with broader regional governance and resource-sector sensitivities. Quebec, the Atlantic provinces, and the territories remain below threshold.
How GeoBit Would Assist
Corporate security teams should deploy AOI Monitoring & Early Warning on Ontario, BC, and Manitoba to capture sub-provincial incident clustering in real time. Intel Sweep and X/Telegram OSINT will corroborate the signals flagged above (Saskatchewan occupation, Vancouver military force event, hospital protest) and clarify foreign actor involvement. Network & Actor Analysis can map relationships between investigative activity at federal and provincial levels, revealing whether scattered signals reflect coordination or independent events.
7-Day Outlook
No acute escalation is anticipated. Current signal density suggests routine investigative and civil-society activity rather than coordinated emergency. If the Saskatchewan occupation, Vancouver military event, or healthcare-sector unrest intensifies or spreads, risk will shift from fragmented to clustered; continuous monitoring is essential. Duty-of-care teams should maintain readiness for localized disruption to Ontario operations and supply chains while refreshing intelligence on foreign-entity engagement signals.
Highest-Risk Areas — Ranked
| # | State / Region | Risk |
|---|---|---|
| 1 | Ontario | 31.6 |
| 2 | Nunavut | 15.4 |
| 3 | British Columbia | 15.3 |
| 4 | Manitoba | 8.9 |
| 5 | Alberta | 7.3 |
| 6 | Quebec | 4.7 |
| 7 | New Brunswick | 3.5 |
| 8 | Prince Edward Island | 2 |
| 9 | Yukon | 1.8 |
| 10 | Northwest Territories | 1.8 |
| 11 | Saskatchewan | 1.8 |
| 12 | Newfoundland and Labrador | 1.6 |
Sources
Previous Daily Briefs
A new Canada brief is written every day — each with its own risk map and downloadable CSV. Here's the last week; use the calendar to go further back.
📅 Browse every day by calendar →
Highlighted days have a brief. Tap a day for that day's map & analysis, or “csv” for that day's dataset ($5).
Atlas — our AI intelligence desk — emails them this snapshot personally. Nothing else, no list.