Situation Summary
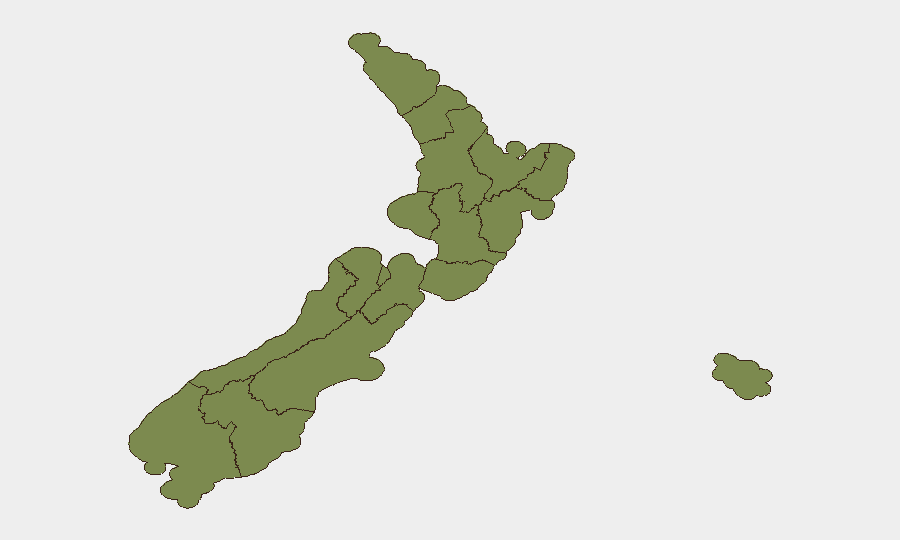
New Zealand's overall security threat environment remains low relative to global peers (rank #157, composite score 4), with no major nationally significant incidents reported in the last 24–48 hours. However, GeoBit's event signals from 2026-07-14 indicate concurrent spikes in localized security incidents, infrastructure disruption, and governance friction, particularly in Canterbury and Auckland, reflecting sustained administrative and public-order pressures rather than sudden escalation. The risk profile is regionally concentrated: Canterbury accounts for nearly one-third of all tracked threat signals, while the remaining eleven regions collectively show moderate to minimal exposure. Trajectory remains stable at present, though institutional and law-enforcement activity warrants continued monitoring.
Key Developments
GeoBit's platform data from 2026-07-14 identifies the following activity signals, though open-source corroboration remains limited:
- Canterbury (Christchurch) – Institutional friction: Ministry investigation, administrative sanctions against a politician, and public statements reflecting governance or procedural tension (2026-07-14). Underlying facts not independently time-stamped in mainstream media within the last 48 hours.
- Auckland – Law-enforcement operations: Police deployment of "unconventional violence protocols" and arrest/detainment activity linked to public-order incidents (2026-07-14). Routine arrests and disorder are documented in regional reporting, but specific incident details are not precisely dated to the past 24–48 hours.
- Auckland (Karangahape Road): Recent violence near Karanga-a-Hape (Mercury Lane) City Rail Link station, including bar brawl and separate serious-injury incident within days of mid-July reporting; calls for 24-hour police presence issued. Specific incident dates not confirmed for the last 48 hours.
- Nationwide – Low overall advisory status: Australian Smartraveller advisory unchanged; no new incident-specific alerts or updates in the last 24–48 hours. Standard emergency contact (111) and non-emergency police (105) procedures remain current.
Note: GeoBit event signals from 2026-07-14 include additional activity (disapproval statements, public statements from hospital and community actors, sanctions notices) but lack independent, clearly time-stamped corroboration in open media falling strictly within the 24–48-hour window. These reflect concurrent institutional and social pressure rather than discrete, dateable incidents.
Highest-Risk Areas
Canterbury dominates the regional risk ranking (31.8), driven by institutional friction, administrative scrutiny, and documented infrastructure concerns reported in the 24–48-hour event spike. Wellington (18.0) and Auckland (17.1) follow, with Auckland's risk reflecting ongoing public-order and law-enforcement activity, particularly around the City Rail Link infrastructure and inner-city precincts. Otago (16.6) rounds the high-risk tier. Together, these four regions account for approximately 83 of the 118 tracked events nationwide; the remaining eight regions show risk scores below 9, indicating that overall national threat is heavily localized and that risk exposure for corporates or personnel depends critically on operational footprint within Canterbury, Auckland, or Wellington.
How GeoBit Would Assist
Intel Sweep and multi-language OSINT fusion enable early identification of institutional and public-order signals before they escalate into broader disruption. AOI Monitoring & Early Warning with persistent watch on Canterbury, Auckland, and Wellington would provide continuous alerting on governance, infrastructure, and law-enforcement activity. Network & Actor Analysis would map relationships among officials, agencies, and protest/community actors to anticipate friction points and personnel-safety risks in affected regions.
7-Day Outlook
Institutional and law-enforcement activity is expected to persist in Canterbury and Auckland, with no indicators of rapid de-escalation. Infrastructure and governance tensions may generate further administrative or public statements, but likelihood of citywide disruption or violence remains low. Personnel and asset managers should maintain standard precautions and monitor regional updates via GeoBit's AOI alerts.
Highest-Risk Areas — Ranked
| # | State / Region | Risk |
|---|---|---|
| 1 | Canterbury | 31.8 |
| 2 | Wellington | 18 |
| 3 | Auckland | 17.1 |
| 4 | Otago | 16.6 |
| 5 | Marlborough | 8.5 |
| 6 | Bay of Plenty | 7.1 |
| 7 | Hawke's Bay | 4.7 |
| 8 | West Coast | 3.7 |
| 9 | Waikato | 3.2 |
| 10 | Northland | 2.3 |
| 11 | Chatham Islands | 1.8 |
| 12 | Taranaki | 1.8 |
Sources
Previous Daily Briefs
A new New Zealand brief is written every day — each with its own risk map and downloadable CSV. Here's the last week; use the calendar to go further back.
📅 Browse every day by calendar →
Highlighted days have a brief. Tap a day for that day's map & analysis, or “csv” for that day's dataset ($5).
Atlas — our AI intelligence desk — emails them this snapshot personally. Nothing else, no list.