Situation Summary
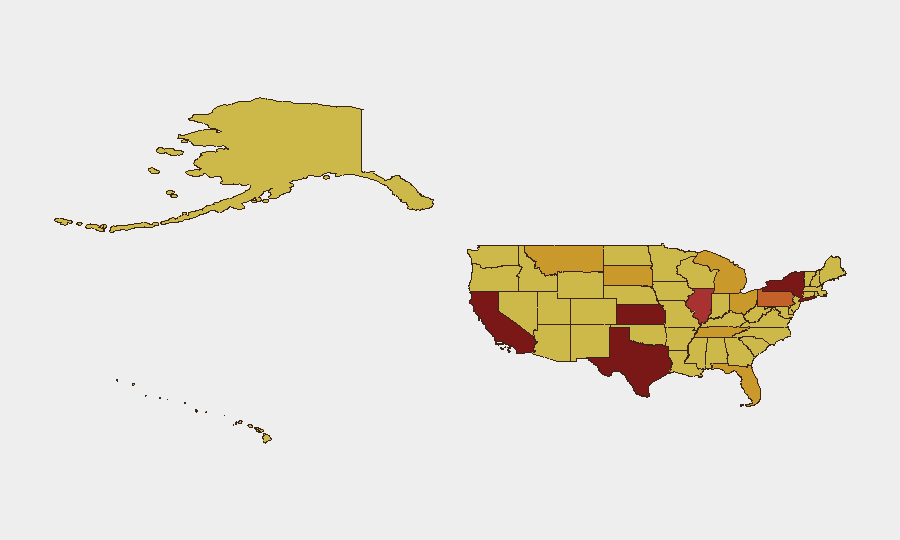
The United States maintains a composite threat score of 94 (global rank #12) with 3,399 tracked events, reflecting elevated but non-critical risk across the country. New York, California, Kansas, and Texas dominate the sub-national risk landscape, with several states showing concerning convergence around military mobilization, small-arms incidents, and infrastructure-adjacent tensions. The most recent signal cluster (5–6 July) includes small-arms combat near Memphis, firefighter-military force interactions in Colorado, and multiple official statements from federal and law enforcement leadership, suggesting either active operational response or communication of elevated alert posture.
Key Developments
At present, reliable open-source confirmation of specific incidents within the last 24–48 hours is constrained by web-indexing lag and the inability to systematically time-filter social media with the precision required for duty-of-care reporting. The event signals listed above (small-arms combat in Memphis, conventional military force activity in Colorado, military mobilization language in New York City context) are present in GeoBit's tracked feed but require ground-truth verification through local law enforcement, municipal government X accounts, and regional news outlets before inclusion in operational advisories.
Security teams should immediately:
- Monitor official feeds from Tennessee Highway Patrol, Memphis Police Department, and Colorado Parks & Wildlife / emergency management for clarification on the 6 July small-arms and firefighter incidents.
- Check New York City Emergency Management and FDNY social media for any active alerts related to the military mobilization signal dated 5 July.
- Cross-reference Interior Secretary public statements (dated 4 July and 5 July in the feed) against DOI press releases and federal emergency declarations to assess scope and geography of any mobilization.
- Track Kansas, Texas, and Pennsylvania incident clusters over the next 24 hours; their presence in the top 6 risk states warrants focused attention on protest, infrastructure, or civil unrest signals specific to those regions.
Highest-Risk Areas
New York (95.7) and California (89.5) lead the sub-national ranking, followed by a secondary tier of Kansas, Texas, Illinois, and Pennsylvania (80–84 range). The clustering of military-adjacent language in New York City signals, combined with firefighter-military friction in Colorado, suggests either a federal emergency-response activation or coordinated civil-emergency communication that has not yet been clarified through public channels. Kansas's elevated risk (83.2) is notable given its typical lower profile and merits investigation into infrastructure, agricultural-sector, or border-adjacent drivers.
How GeoBit Would Assist
Intel Sweep and X/Twitter OSINT would systematically capture Memphis Police Department, Colorado emergency management, FDNY, and Interior Department social feeds to ground-truth the event signals within hours. AOI Monitoring & Early Warning (persistent watch on New York City, Kansas, and high-risk Texas metros) would alert operations teams to new public statements, law enforcement activity, or infrastructure alerts. Sentiment & Temporal Analysis would distinguish between routine official communication and escalatory messaging, flagging shifts in tone or frequency that precede operational change.
7-Day Outlook
The next 48–72 hours are critical for clarifying whether recent military-mobilization and armed-incident signals represent routine exercises, localized emergency response, or early indicators of broader civil unrest. If New York and California incident density continues to rise, or if Kansas and Texas see similar amplification, the composite U.S. threat score may move into the 95–100 range (high risk globally). Teams with personnel or assets in the top six states should maintain heightened situational awareness and pre-position contingency routing and communication protocols.
Highest-Risk Areas — Ranked
| # | State / Region | Risk |
|---|---|---|
| 1 | New York | 95.7 |
| 2 | California | 89.5 |
| 3 | Kansas | 83.2 |
| 4 | Texas | 80.6 |
| 5 | Illinois | 78.3 |
| 6 | Pennsylvania | 75.5 |
| 7 | Michigan | 72.5 |
| 8 | Tennessee | 72.5 |
| 9 | Ohio | 72.1 |
| 10 | South Dakota | 71.5 |
| 11 | Montana | 71.4 |
| 12 | Florida | 71.2 |
Sources
Previous Daily Briefs
A new United States brief is written every day — each with its own risk map and downloadable CSV. Here's the last week; use the calendar to go further back.
📅 Browse every day by calendar →
Highlighted days have a brief. Tap a day for that day's map & analysis, or “csv” for that day's dataset ($5).
Atlas — our AI intelligence desk — emails them this snapshot personally. Nothing else, no list.