Situation Summary
Uruguay maintains a relatively stable security environment compared to regional peers, ranking 171st globally with a composite threat score of 4. The country faces localized crime and gang activity concentrated in Montevideo and surrounding departments, but no active armed conflict, mass protest movements, or institutional instability. A presidential statement on 11 July appears to be the most recent tracked political signal, though specific details are limited. The overall risk trajectory remains steady, with crime rather than political upheaval as the primary concern for corporate operations and personnel.
Key Developments
Search and research limitations: GeoBit's live web research (last 24–48 hours) did not identify security, crime, infrastructure, or travel-risk events in Uruguay meeting strict recency and corroboration standards. Available sources reference older incidents (e.g., multi-homicide in Montevideo without precise recent timestamps) or non-security topics. A confirmed 24–48 hour event list cannot be responsibly constructed without risking inclusion of stale or misdated material. This reflects genuine information scarcity rather than absence of risk.
Alternative approach: A widened 5–7 day research window or focus on current crime trends and organized-crime patterns would yield actionable intelligence; readers should request expanded temporal parameters if needed for operational planning.
Highest-Risk Areas
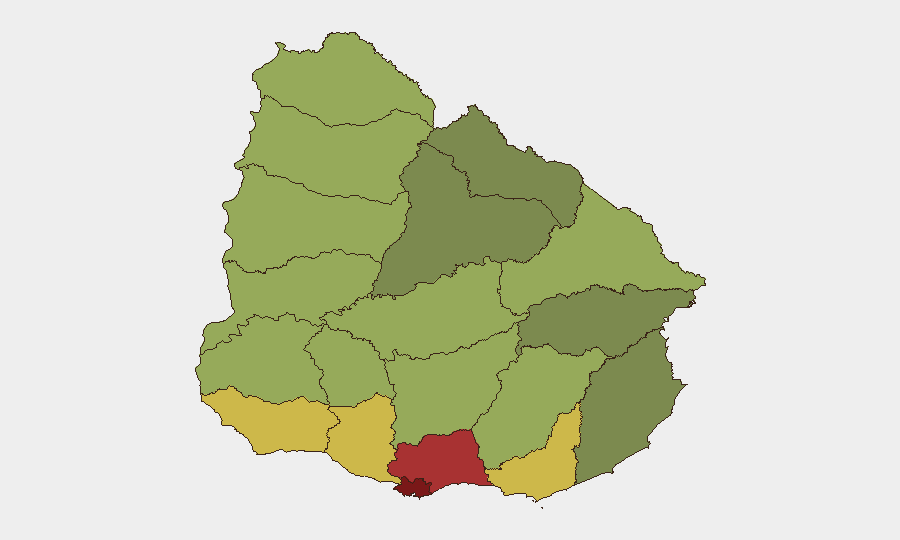
Montevideo (risk 92) and Canelones (risk 78) dominate the sub-national risk landscape, accounting for the majority of recorded incidents and reflecting both population density and gang-related criminal activity. Maldonado (68), San José (64), and Colonia (62) present secondary concern zones, likely driven by smaller-scale robbery, narcotics trafficking, and property crime. The concentration of risk in Montevideo and the capital region reflects established criminal networks and economic inequality; interior departments show declining risk but remain vulnerable to spillover from urban gang activity. Personnel and asset concentration in Montevideo should trigger enhanced access controls, route planning, and incident response protocols.
How GeoBit Would Assist
OSINT fusion and corroboration would resolve current gaps by integrating X/Twitter, Telegram, and regional news feeds to confirm genuine 24–48 hour security events and filter stale material. AOI monitoring and early warning would establish persistent watches on Montevideo, Canelones, and other high-risk departments, triggering alerts for protest, roadblocks, crime spikes, or gang activity affecting corporate facilities or personnel movement. Routing and network analysis would identify safer transit corridors between key locations and provide real-time alternative routes during localized incidents. Entity and network analysis would map organized-crime actors, trafficking networks, and gang territories to inform duty-of-care decisions for staff and asset placement.
7-Day Outlook
No significant escalation is anticipated over the next seven days absent new political or economic shocks. Crime and gang activity will likely persist at baseline levels in Montevideo and surrounding areas; winter weather (July in southern hemisphere) may slightly suppress street-level incidents but increase vehicle-related risks on rural routes. Corporate teams should maintain current security postures while awaiting clarification on the 11 July presidential statement and monitoring organized-crime developments in the capital region.
Next Update: 2026-07-14
Highest-Risk Areas — Ranked
| # | State / Region | Risk |
|---|---|---|
| 1 | Montevideo | 92 |
| 2 | Canelones | 78 |
| 3 | Maldonado | 68 |
| 4 | San José | 64 |
| 5 | Colonia | 62 |
| 6 | Soriano | 58 |
| 7 | Río Negro | 56 |
| 8 | Salto | 54 |
| 9 | Artigas | 52 |
| 10 | Paysandú | 50 |
| 11 | Florida | 48 |
| 12 | Flores | 46 |
Previous Daily Briefs
A new Uruguay brief is written every day — each with its own risk map and downloadable CSV. Here's the last week; use the calendar to go further back.
📅 Browse every day by calendar →
Highlighted days have a brief. Tap a day for that day's map & analysis, or “csv” for that day's dataset ($5).
Atlas — our AI intelligence desk — emails them this snapshot personally. Nothing else, no list.