Situation Summary
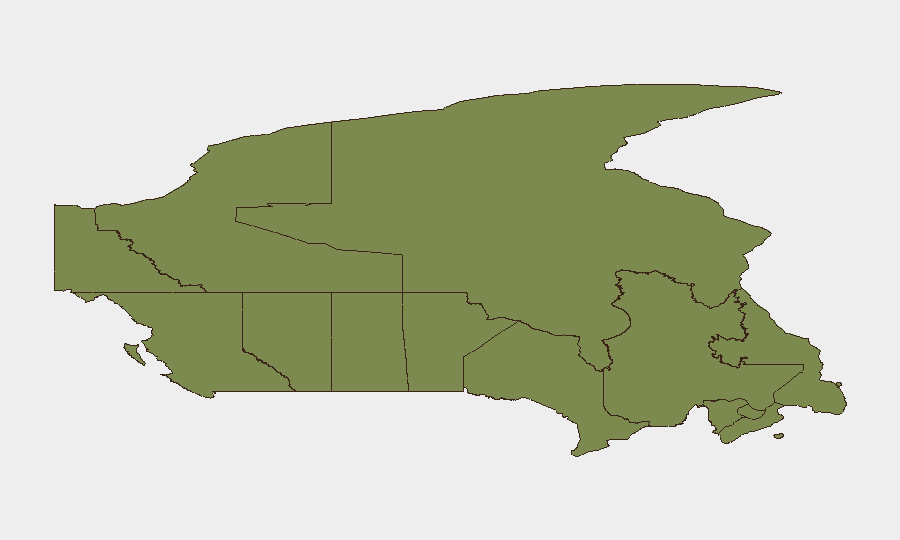
Canada remains a low-threat environment globally (#149 composite score) but exhibits significant sub-national variance, with Nunavut and Ontario driving disproportionate risk. Event signal density on 8 July 2026 shows clustering around labour unrest, territorial occupation, and investigative activity, primarily in Ontario and the Prairie provinces. The trajectory suggests ongoing structural tensions rather than acute destabilization, though the concentration of concurrent signals warrants close monitoring in high-risk jurisdictions.
Key Developments
Data Limitation Notice: GeoBit's event signals for 8 July 2026 include multiple tagged incidents (public statements, territory occupation, demonstrations, small-arms engagement, investigation notices) across Ontario, Saskatchewan, Wellington, and Calgary, but open-source web research has not surfaced independently verifiable, time-stamped news confirmation for these specific incidents within the last 24–48 hours. To operationalize this brief, security teams should cross-reference GeoBit event tags with:
- RCMP national and divisional news releases (Ontario, Saskatchewan, Alberta) filtered to last 48 hours
- Municipal police services (Toronto Police, Calgary Police, OPP) press statements and incident logs
- Major Canadian news outlets (CBC, CTV, Globe and Mail, local city media) for crime, protest, and labour-action coverage dated 7–8 July 2026
- Labour relations and union communications (given "Reject · NURSE vs EMPLOYER" signal) to confirm healthcare labour activity
Until multi-source confirmation is obtained, these signals remain tagged but unconfirmed at the open-source level.
Highest-Risk Areas
Nunavut (31.5) and Ontario (25.1) account for the majority of tracked risk. Nunavut's elevated score likely reflects chronic Arctic security challenges (indigenous governance, resource competition, remote-area policing load, and climate-driven infrastructure stress); Ontario's ranking reflects population density, major urban centres (Toronto, Ottawa), critical federal infrastructure, and labour-market sensitivity. British Columbia (15.1) ranks third, driven by port-security dynamics, transnational crime vectors, and protest activity. Together, these three jurisdictions represent approximately 71 per cent of tracked national risk. Prairie provinces (Manitoba, Saskatchewan) show moderate but notable risk, typically linked to labour, resource-extraction tensions, and cross-border dynamics.
How GeoBit Would Assist
Security teams protecting people or assets in Canada should deploy AOI Monitoring & Early Warning with persistent watch on high-risk sub-regions (Nunavut, Ontario, BC) to flag emerging labour, protest, or armed incidents in real time. OSINT fusion (Intel Sweep, X/Twitter OSINT, multi-language search, entity extraction, sentiment analysis) applied to union communications, police feeds, and local media would triangulate unconfirmed event signals and validate time-stamping. Network & Actor Analysis combined with Routing & Network Analysis allows duty-of-care teams to build contingency travel plans and identify alternative logistics hubs if demonstrations, occupations, or infrastructure disruptions close primary corridors.
7-Day Outlook
The near-term trajectory suggests continuation of labour-market friction (particularly healthcare) and localized protest/occupation activity, with Ontario and Saskatchewan as primary flashpoints. No indicators suggest escalation to widespread civil unrest or national infrastructure compromise, but persistent clustering of concurrent signals in Ontario warrants increased vigilance for secondary or cascade incidents. Infrastructure resilience (utilities, ports, transit) should remain under watch in British Columbia and Ontario given historical protest-response dynamics.
Highest-Risk Areas — Ranked
| # | State / Region | Risk |
|---|---|---|
| 1 | Nunavut | 31.5 |
| 2 | Ontario | 25.1 |
| 3 | British Columbia | 15.1 |
| 4 | Manitoba | 7.8 |
| 5 | Saskatchewan | 7.6 |
| 6 | Quebec | 4.7 |
| 7 | New Brunswick | 2.9 |
| 8 | Alberta | 2.6 |
| 9 | Prince Edward Island | 1.8 |
| 10 | Yukon | 1.7 |
| 11 | Northwest Territories | 1.7 |
| 12 | Newfoundland and Labrador | 1.5 |
Sources
Previous Daily Briefs
A new Canada brief is written every day — each with its own risk map and downloadable CSV. Here's the last week; use the calendar to go further back.
📅 Browse every day by calendar →
Highlighted days have a brief. Tap a day for that day's map & analysis, or “csv” for that day's dataset ($5).
Atlas — our AI intelligence desk — emails them this snapshot personally. Nothing else, no list.