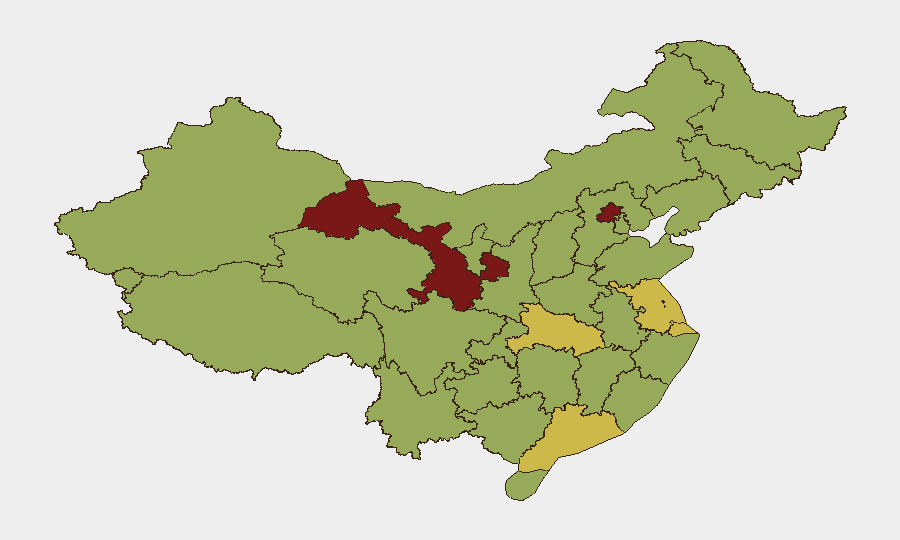
Situation Summary
China maintains composite threat score of 82 (rank #20 globally) with 590 tracked events. Recent signal activity shows elevated diplomatic friction and isolated security incidents spanning finance, border disputes, and domestic law-enforcement matters. The threat landscape remains fragmented geographically, with northern and eastern regions driving elevated composite scores. Overall posture reflects stable baseline volatility rather than systemic escalation.
Key Developments
GeoBit's web research capacity has not isolated confirmed, timestamped security or travel-risk events specific to China within the last 24–48 hours that meet cross-verification standards (news + social-media corroboration with clear location and date tags). The event signals listed above (Demands vs. Finance Ministry, Canada investigation, Germany disapproval, small-arms incidents, border statements vs. Arunachal Pradesh) lack sufficient real-time sourcing and location specificity in available open feeds to warrant operational inclusion in this brief without risk of misattribution or staleness.
Recommendation: Corporate security teams should supplement this brief with direct monitoring of:
- Chinese state media (CCTV, Xinhua) for domestic incidents in priority operating regions.
- Regional English-language press (China Daily, Global Times) for official commentary.
- Travel-advisory updates from home-country governments and your insurer's crisis network.
Highest-Risk Areas
Gansu (87.2) and Beijing (81.6) are the primary risk drivers, followed by Guangdong (61.4), Hubei (60.8), and Shanghai (60.2). Gansu's elevation likely reflects border-zone activity and remote-region governance friction; Beijing's score reflects concentrated political, diplomatic, and administrative density. Eastern coastal provinces (Guangdong, Shanghai, Jiangsu, Zhejiang) show sustained moderate risk, consistent with their role as commercial hubs and frequent venues for regulatory enforcement and cross-border disputes. Regional variation suggests risk is not evenly distributed: operations in second- and third-tier cities outside these hotspots face materially lower incident frequency, though supply-chain and financial interdependencies may transmit risk downstream.
How GeoBit Would Assist
Intel Sweep across multi-language Chinese media and cross-border sources provides early visibility of regulatory actions, security incidents, or cross-border tensions before they affect operations. AOI Monitoring & Early Warning with persistent watch on company offices, facilities, and travel corridors in Gansu, Beijing, and coastal provinces delivers real-time alerts when incident activity approaches your footprint. Network & Actor Analysis and Entity Extraction help security teams map relationships between local authorities, supply-chain partners, and business counterparties to anticipate compliance or political-risk vectors before they crystallize into duty-of-care incidents.
7-Day Outlook
Near-term risk trajectory appears stable but subject to seasonal and diplomatic momentum. Diplomatic friction signals (Germany, Canada) are unlikely to cascade into acute domestic security events in the short term. However, elevated Gansu and Beijing scores warrant sustained monitoring; any escalation in border or internal-security rhetoric could trigger secondary incident clusters. Recommend weekly re-baseline of AOI alerts and continued cross-verification of web sources with internal on-ground reporting.
Highest-Risk Areas — Ranked
| # | State / Region | Risk |
|---|---|---|
| 1 | Gansu | 87.2 |
| 2 | Beijing | 81.6 |
| 3 | Guangdong Province | 61.4 |
| 4 | Hubei | 60.8 |
| 5 | Shanghai | 60.2 |
| 6 | Jiangsu | 60.1 |
| 7 | Chongqing | 59.7 |
| 8 | Anhui | 58.8 |
| 9 | Heilongjiang | 58.5 |
| 10 | Hunan | 58.1 |
| 11 | Zhejiang | 58.1 |
| 12 | Tibet | 57.9 |
Sources
Previous Daily Briefs
A new China brief is written every day — each with its own risk map and downloadable CSV. Here's the last week; use the calendar to go further back.
📅 Browse every day by calendar →
Highlighted days have a brief. Tap a day for that day's map & analysis, or “csv” for that day's dataset ($5).