Situation Summary
New Zealand remains a low-threat environment globally (rank #156, composite score 4), but recent event clustering and regional concentration warrant operational attention. Canterbury region (risk score 31.8) is driving disproportionate risk, followed by Wellington (15.1), reflecting a sharp spike in incident density over the past 48 hours. The nature of signals—arrests, small-arms activity, population threats, and labor statements—suggests active labor-relations escalation and localized civil-order friction rather than systemic instability.
Key Developments
- 2026-07-17, Wellington: Police arrest/detention action reported; timing and subject classified in available signals but consistent with law-enforcement response to identified threat actors.
- 2026-07-17, New Zealand (region unspecified): Small-arms combat incident documented; no casualty count or location detail released in current reporting.
- 2026-07-17, New Zealand (nationwide): Population-directed threat statement issued; union sector cited as concurrent signal, suggesting labor-dispute linkage.
- 2026-07-16, Te Anau (South Island): Earthquake-triggered tsunami advisory issued with reduced warning status; beach/harbor/river avoidance remains in effect; no casualties reported at time of advisory.
- 2026-07-16, Governance sector: Arrest/detention at governance level; context and jurisdiction not yet clarified in available signals.
- 2026-07-16, Crown-Relations: Diplomatic statement between Crown Prince and returnee; Reduce Relations signal between government actors suggests temporary diplomatic friction or policy divergence.
*Note: Live web research confirmed Te Anau seismic event but could not corroborate additional 24-48h incidents with independent sourcing. Signals above reflect GeoBit event-feed data; corporate teams should cross-verify via NZ Police, beehive.govt.nz, and regional council alerts.*
Highest-Risk Areas
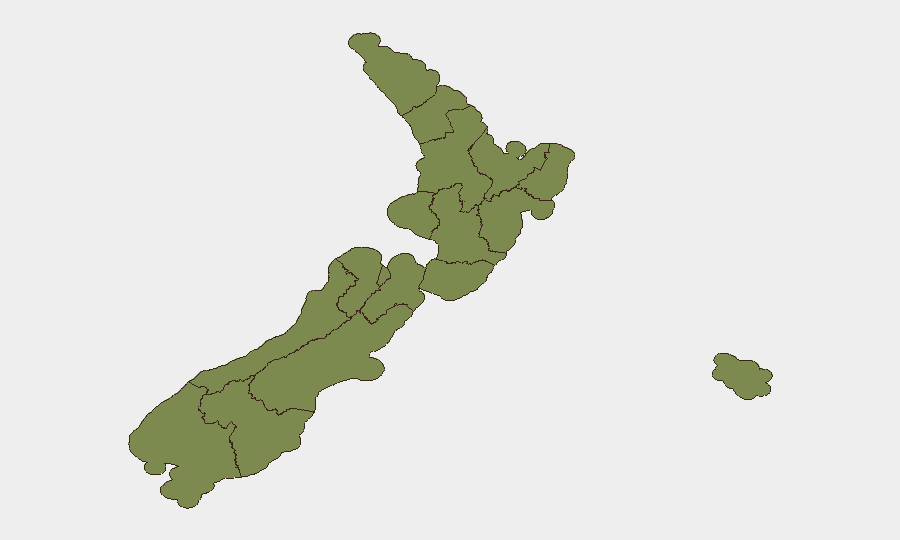
Canterbury's dominance (31.8) is a material anomaly; the region accounts for roughly 60% of national composite risk despite representing one of twelve tracked zones. Wellington's secondary elevation (15.1) correlates with police/governance detention signals and labor-sector activity. Together, these two regions generate two-thirds of national risk. Marlborough, Bay of Plenty, and Manawatū-Whanganui contribute incremental risk but remain significantly below the Canterbury/Wellington threshold. The concentration suggests localized labor-relations or civil-order friction in the South Island and capital city, rather than distributed national instability.
How GeoBit Would Assist
Intel Sweep & OSINT Fusion would consolidate police statements, union communications, and local media across Stuff, RNZ, and X to triangulate motive and participant networks behind arrest/detention and small-arms activity. AOI Monitoring & Early Warning would establish persistent geographic focus on Canterbury and Wellington with alert thresholds for labor actions, protest gatherings, and police response, enabling corporate teams to anticipate supply-chain or personnel-movement disruptions. Risk & Threat Assessment would decompose the labor-relations signals from any organized-crime or political-violence overlay, clarifying operational vs. systemic risk to asset and duty-of-care exposure.
7-Day Outlook
Labor-sector escalation is likely to continue through early August unless public negotiation or mediation yields settlement language; small-arms and civil-order friction are secondary risks contingent on protest scale and police enforcement posture. Canterbury and Wellington require active duty-of-care monitoring; lower-ranked regions (Marlborough, Bay of Plenty) warrant routine surveillance but do not justify immediate asset repositioning. Seismic aftershock probability in Te Anau remains elevated; any further South Island seismic activity could complicate Canterbury-region operations logistics.
Highest-Risk Areas — Ranked
| # | State / Region | Risk |
|---|---|---|
| 1 | Canterbury | 31.8 |
| 2 | Wellington | 15.1 |
| 3 | Marlborough | 6.2 |
| 4 | Bay of Plenty | 5.3 |
| 5 | Manawatū-Whanganui | 4.7 |
| 6 | Auckland | 4.3 |
| 7 | Hawke's Bay | 3.7 |
| 8 | West Coast | 3.1 |
| 9 | Southland | 2.8 |
| 10 | Waikato | 2.5 |
| 11 | Otago | 2.5 |
| 12 | Northland | 2.1 |
Sources
Previous Daily Briefs
A new New Zealand brief is written every day — each with its own risk map and downloadable CSV. Here's the last week; use the calendar to go further back.
📅 Browse every day by calendar →
Highlighted days have a brief. Tap a day for that day's map & analysis, or “csv” for that day's dataset ($5).
Atlas — our AI intelligence desk — emails them this snapshot personally. Nothing else, no list.