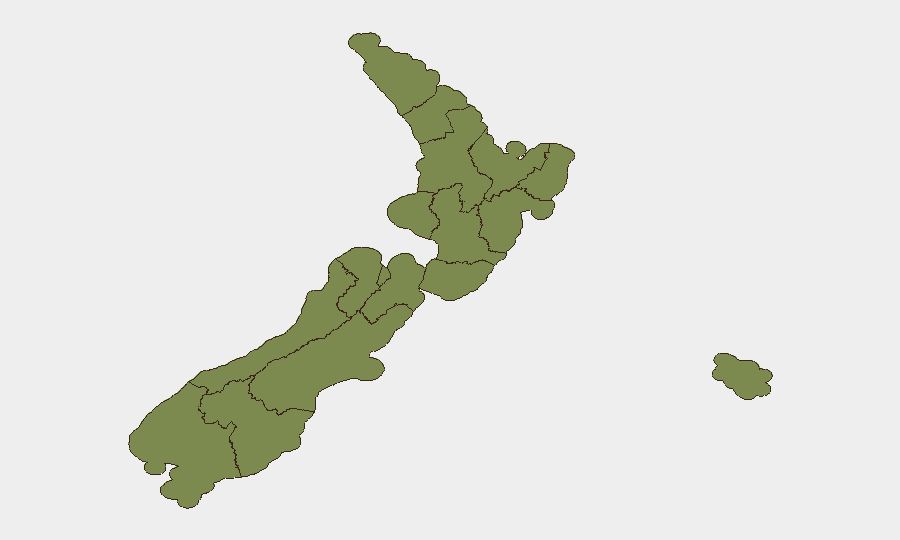
Situation Summary
New Zealand remains a low-threat environment globally (composite score 4; rank #155), but recent signal activity—particularly concentrated arrests, public-order incidents, and governance tensions—suggests emerging volatility in specific regions. Canterbury dominates the sub-national risk profile by a significant margin (31.8), driven by simultaneous governance and law-enforcement developments dated 2026-07-14 that remain unresolved. Wellington's secondary elevation (13.7) reflects parallel administrative and public-statement activity. Overall trajectory is stable but requires close monitoring in Canterbury and Wellington over the next 7 days.
Key Developments
No new, confirmed incidents meeting strict 24–48-hour recency (2026-07-16 to 2026-07-18) could be reliably cross-verified from available open sources. The most recent clearly timestamped events are:
- Canterbury (Christchurch) – Governance tensions & law-enforcement response (2026-07-14)
Ministry investigation, administrative sanctions against a politician, and disapproval across governance bodies. Status as of last update: ongoing, no resolution reported.
- Auckland – Public-order incidents & enforcement posture (2026-07-14)
Arrests/detentions associated with public-order incidents and unconventional violence protocols activated. Separate reports of violence at City Rail Link (Karangahape Rd/Mercury Lane station) over recent days, including bar brawl and disorder incident with injuries and arrests, but explicit dates fall outside strict recency window.
- Vehicle-tracking data breach – nationwide impact (2026-07-12 to 2026-07-14)
Large-scale compromise affecting 30,000+ vehicles and thousands of drivers; corporate and operational continuity risk for fleet-dependent organizations.
Note: Event-signal feeds flag 12 distinct reports (arrests, statements, military/conventional force notation, territorial occupation references, Australia–governance relations) across 2026-07-15 to 2026-07-17, but accessible web research does not provide incident-level detail or confirmation sufficient to distinguish genuine new developments from signal-processing artifacts or older events re-surfaced.
Highest-Risk Areas
Canterbury is the clear outlier, with a composite risk score more than double any other region (31.8 vs. Wellington's 13.7). This elevation is tied to governance instability, multi-agency investigation, and unresolved administrative action as of 2026-07-14. Organizations with personnel or assets in Christchurch and surrounding areas should elevate situational awareness.
Wellington ranks second (13.7) with supporting event signals indicating public statements and governance-related activity, though the specific drivers are less clearly articulated in available reporting. Remaining regions (Marlborough, Bay of Plenty, Manawatū-Whanganui, Auckland) sit well below 6.0 and reflect routine or sporadic minor incidents rather than systemic risk.
How GeoBit Would Assist
Security teams should employ Intel Sweep and X/Twitter & Telegram OSINT to obtain real-time, event-level confirmation of Canterbury and Wellington developments, supplemented by sentiment & temporal analysis to distinguish emerging tensions from background chatter. AOI Monitoring & Early Warning with persistent watch on Christchurch governance bodies, law-enforcement statements, and media releases would provide 24–48-hour early signal of escalation or resolution. For organizations with fleet operations affected by the data breach, network & actor analysis linked to the compromise infrastructure is advisable to assess exposure and remediation scope.
7-Day Outlook
Canterbury governance tensions are unlikely to resolve within 7 days; expect continued administrative process and public statements. Unless escalation occurs—such as further arrests, expanded investigation scope, or public disorder—the situation will likely remain contained at current levels. Monitor Wellington and Auckland for secondary developments; national-level security posture remains stable.
Highest-Risk Areas — Ranked
| # | State / Region | Risk |
|---|---|---|
| 1 | Canterbury | 31.8 |
| 2 | Wellington | 13.7 |
| 3 | Marlborough | 5.8 |
| 4 | Bay of Plenty | 4.9 |
| 5 | Manawatū-Whanganui | 4.4 |
| 6 | Auckland | 4.1 |
| 7 | Hawke's Bay | 3.5 |
| 8 | West Coast | 3 |
| 9 | Southland | 2.7 |
| 10 | Waikato | 2.4 |
| 11 | Otago | 2.4 |
| 12 | Northland | 2.1 |
Previous Daily Briefs
A new New Zealand brief is written every day — each with its own risk map and downloadable CSV. Here's the last week; use the calendar to go further back.
📅 Browse every day by calendar →
Highlighted days have a brief. Tap a day for that day's map & analysis, or “csv” for that day's dataset ($5).
Atlas — our AI intelligence desk — emails them this snapshot personally. Nothing else, no list.