Situation Summary
China's composite threat score remains elevated at 95/100 (rank #13 globally), with 841 tracked events flagged across the country in the current cycle. Recent signal activity points to escalating diplomatic friction (Canada investigations, European disapproval), internal governance challenges, and military-adjacent activity. The security environment is showing strain across multiple vectors—diplomatic, administrative, and potentially operational—without indicating an imminent nationwide crisis.
Key Developments
- 2026-07-02 · Military Mobilization (China vs. Military). Location and operational scope not yet clarified; warrants urgent clarification given sensitivity of PLA movements.
- 2026-07-02 · Arrest/Detain (China vs. Taiwan). Taiwan-linked detentions signal elevated cross-strait tension; specific identities and charges not yet confirmed.
- 2026-07-02 · Reject (China vs. Panama). Diplomatic rebuff suggests deteriorating relations; Panama connection likely linked to canal-zone or trade-corridor friction.
- 2026-07-01 · Investigation (Canada vs. China). Second Canada-linked investigation signal in 48 hours; may involve espionage, trade disputes, or consular issues.
- 2026-07-01 · Disapprove (European vs. China). Coordinated European criticism suggests alignment on human rights, trade, or sanctions matters.
- 2026-06-30 · Demand (China vs. Ministry of Finance). Domestic fiscal pressure or internal audit probe; may reflect state liquidity or local-government debt stress.
- 2026-07-02 · Aircraft Incident (Beijing). Small aircraft crashed into CITIC Tower; 13 injured; pilot incident reportedly personal in nature (not terrorism or sabotage). Incident occurred last week; included for situational awareness.
Highest-Risk Areas
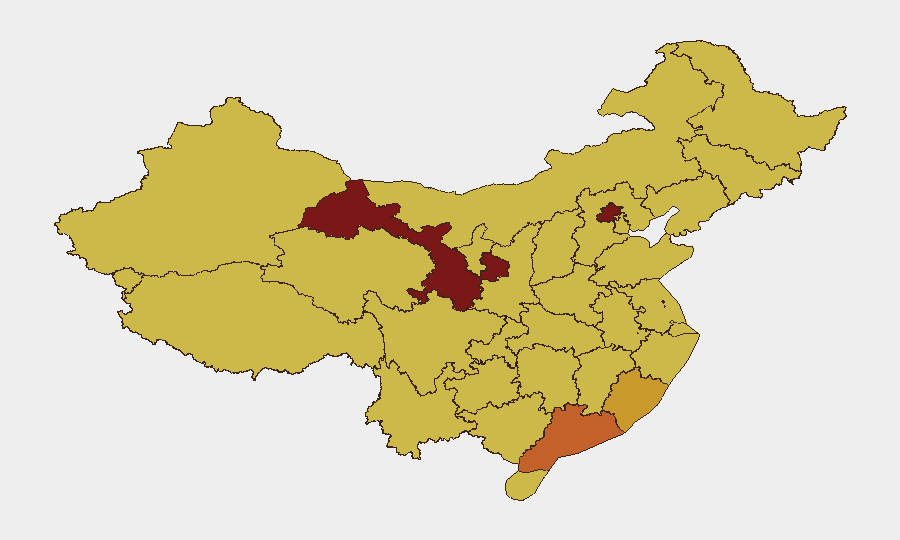
Gansu (96.3), Beijing (88.8), and the eastern manufacturing corridor (Guangdong, Fujian, Jiangsu, Shanghai) together account for the most concentrated risk. Gansu's elevation is noteworthy and warrants investigation into energy-sector instability, border friction (Xinjiang adjacency), or civil-administration breakdown. Beijing's sustained high ranking reflects the capital's role as a nexus for political, diplomatic, and security activity. The eastern seaboard concentration aligns with foreign investment density, cross-strait proximity, and customs/trade chokepoints—areas where corporate exposure is highest.
How GeoBit Would Assist
Corporate security teams should deploy AOI Monitoring & Early Warning on offices and facilities in Gansu, Beijing, Guangdong, and Fujian to catch localized escalation before it disrupts operations. Intel Sweep and OSINT fusion (X/Twitter, Telegram, news feeds, multi-language search) would provide real-time corroboration of diplomatic and military signals—particularly the Canada investigations and military mobilization—allowing teams to anticipate visa delays, asset freezes, or travel restrictions. Network & Actor Analysis would map which state, party, or military entities are driving the current friction, enabling targeted duty-of-care and sanctions-compliance review.
7-Day Outlook
Diplomatic temperature is likely to remain elevated through early July, with Canada and European activity probably intensifying as investigations mature. Military-mobilization and Taiwan-detention signals suggest cross-strait posturing may accelerate, increasing volatility in Fujian, Guangdong, and Liaoning. Corporations with supply-chain, personnel, or financial exposure in the top-risk regions should review continuity protocols and consular communication channels within the next 48–72 hours.
Highest-Risk Areas — Ranked
| # | State / Region | Risk |
|---|---|---|
| 1 | Gansu | 96.3 |
| 2 | Beijing | 88.8 |
| 3 | Guangdong Province | 73.4 |
| 4 | Fujian | 71 |
| 5 | Hubei | 70.9 |
| 6 | Jiangsu | 68.9 |
| 7 | Shanghai | 68.9 |
| 8 | Anhui | 67.9 |
| 9 | Sichuan | 67.8 |
| 10 | Liaoning | 67.5 |
| 11 | Heilongjiang | 67.4 |
| 12 | Chongqing | 67.3 |
Sources
Previous Daily Briefs
A new China brief is written every day — each with its own risk map and downloadable CSV. Here's the last week; use the calendar to go further back.
📅 Browse every day by calendar →
Highlighted days have a brief. Tap a day for that day's map & analysis, or “csv” for that day's dataset ($5).