Situation Summary
North Korea maintains a composite threat score of 73 (global rank #27) with 13 tracked events as of 2026-07-04. Open-source intelligence over the past 24–48 hours does not isolate new, independently confirmed discrete security incidents within North Korea's borders or involving North Korean actors in direct operations. Broader threat vectors—including cryptocurrency theft attributed to North Korean groups (cumulative $643 million in H1 2026), ongoing cyber supply-chain campaigns, and GPS jamming near the inter-Korean maritime boundary (activity concentrated earlier in June)—remain under assessment but do not show fresh escalation in the immediate reporting window.
Key Developments
Assessment of Recent 24–48 Hour Open-Source Coverage:
Open-web and public-source intelligence available as of 2026-07-03 does not support attribution of new, time-stamped security or conflict events occurring specifically on 2026-07-02 or 2026-07-03 within North Korea with cross-source confirmation. Recent reporting cycles have focused on:
- Cumulative cyber-theft statistics (H1 2026) and policy analysis rather than discrete operational incidents in the last 48 hours.
- Retrospective June reviews and inter-Korean rhetorical exchanges (South Korea's Unification Ministry terminology debate on 2026-07-03, not a North Korea–side incident).
- General assessments of North Korean hacking supply-chain expansion and Russia–North Korea sanctions compliance—both medium-term analytical pieces without precise operational dates in the July 2–3 window.
- Prior-month GPS jamming concerns near the maritime border, explicitly not reported as active in the last 24–48 hours by South Korean authorities.
Recommendation: Risk and duty-of-care teams should note that absence of reported new incidents does not indicate reduced threat posture. Cryptocurrency and cyber-espionage campaigns attributed to North Korean actors continue at scale; however, no fresh triggering event requiring immediate operational response appears in the last 48 hours of open-source intelligence.
Highest-Risk Areas
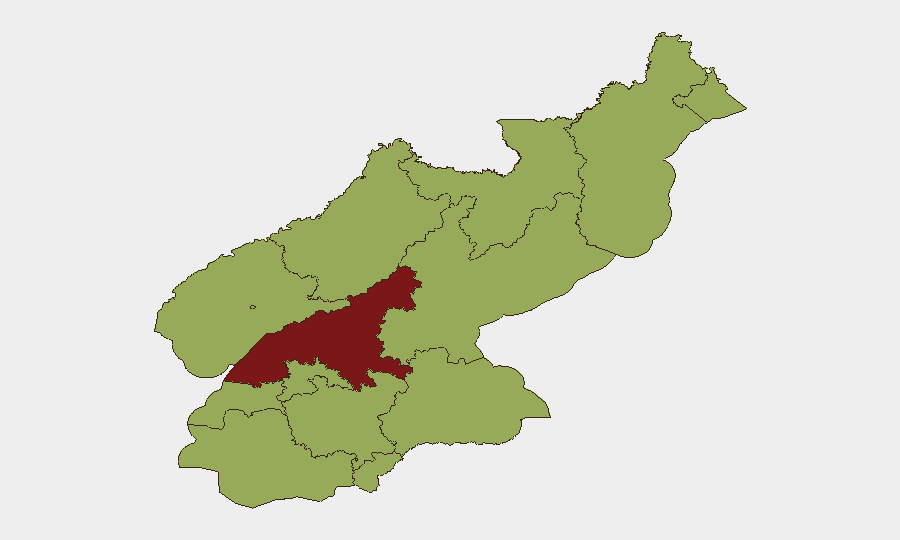
South Pyongan (81.2) significantly exceeds all other sub-national regions and warrants priority monitoring. Pyŏngyang (57.8) maintains elevated risk despite its capital-city status and tighter security apparatus, likely reflecting concentrated economic activity, diplomatic presence, and foreign-national populations. The remaining ten tracked provinces cluster in the 51.2–53.4 range, indicating relatively distributed baseline risk across the country with notable elevation in border regions (North Pyongan, Ryanggang, North Hamgyong, Chagang) and industrial/port zones (Nampo). Differential risk in South Pyongan may reflect industrial infrastructure, inter-Korean contact points, or data-collection bias; assessment teams should clarify risk drivers for operational prioritization.
How GeoBit Would Assist
Security teams managing North Korea exposure should deploy AOI Monitoring & Early Warning on high-risk provinces (South Pyongan, Pyŏngyang, border regions) with persistent satellite and OSINT fusion to detect sudden military, infrastructure, or crowd-movement anomalies before open-source confirmation. Intel Sweep (global event feeds, multi-language OSINT, X/Telegram monitoring, and entity extraction) provides real-time signal detection across Korean-language, Russian, and Chinese sources—capturing regime statements, sanctions developments, and cyber campaigns earlier than English-language press. Cyber domain search and Network & Actor Analysis tracks attribution and operational patterns of North Korean hacking groups, enabling duty-of-care teams to assess exposure to supply-chain and financial-sector threats.
7-Day Outlook
No imminent escalation is signaled by current open-source intelligence; however, sustained cryptocurrency and cyber operations by North Korean actors will continue. Diplomatic and rhetorical activity between North and South Korea, alongside Russia–North Korea sanction dynamics, should be monitored for indicators of policy shifts or sanctions evasion that could alter operational risk profiles for foreign personnel and assets.
Highest-Risk Areas — Ranked
| # | State / Region | Risk |
|---|---|---|
| 1 | South Pyongan | 81.2 |
| 2 | P'yŏngyang | 57.8 |
| 3 | North Pyongan | 53.4 |
| 4 | Ryanggang | 51.2 |
| 5 | North Hamgyong | 51.2 |
| 6 | Chagang | 51.2 |
| 7 | Nampo | 51.2 |
| 8 | South Hwanghae | 51.2 |
| 9 | North Hwanghae | 51.2 |
| 10 | South Hamgyong | 51.2 |
| 11 | Kaesong | 51.2 |
| 12 | Kangwon | 51.2 |
Sources
Previous Daily Briefs
A new North Korea brief is written every day — each with its own risk map and downloadable CSV. Here's the last week; use the calendar to go further back.
📅 Browse every day by calendar →
Highlighted days have a brief. Tap a day for that day's map & analysis, or “csv” for that day's dataset ($5).