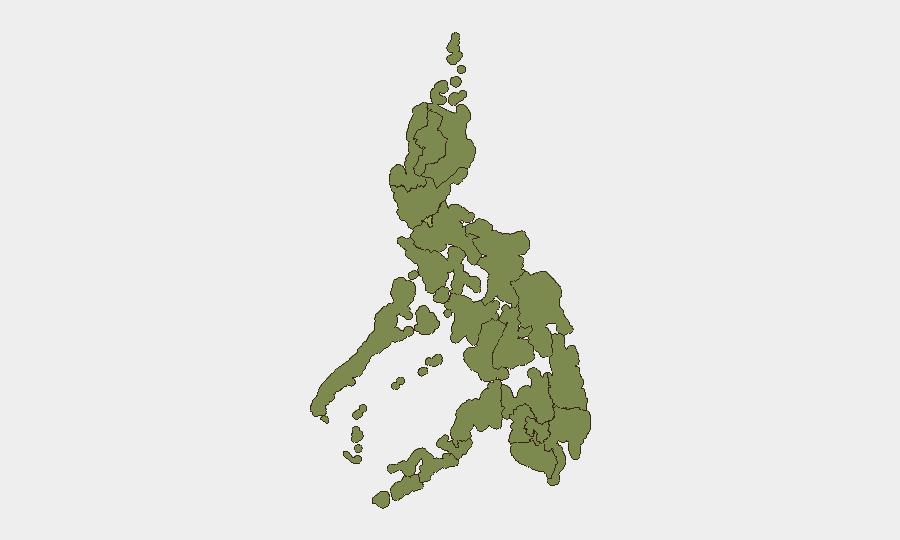
Situation Summary
The Philippines remains at moderate global risk (rank #53, composite score 33) with 73 tracked threat events. Open-source monitoring over the last 24–48 hours has not identified discrete, cross-confirmed security incidents, armed clashes, terror attacks, or infrastructure failures meeting verification standards. Routine crime, localized civil-administrative disputes, and weather-related impacts continue, but no acute escalation in the national threat posture is evident.
Key Developments
No major, independently verified security or civil-unrest incidents meeting professional confirmation standards have been identified in the Philippines in the last 24–48 hours. Open-source feeds (news wires, government alerts, and social-media OSINT) show primarily routine political statements, institutional activity, and aggregated crime statistics rather than dated, discrete new incidents. The most recent armed-conflict entry in official incident tracking (DSWD DROMIC) dates to 20 July 2026 in Brgy. Nabalawag, Soccsksargen (BARMM), outside the current 24–48-hour reporting window. Regional news coverage includes ongoing references to crime, flooding, and volcanic ash effects, but these lack clear recent timestamps or represent cumulative rather than new incidents. No travel restrictions, infrastructure closures, or emergency declarations have been announced at national level in the last 48 hours.
Highest-Risk Areas
Metro Manila dominates the sub-national risk ranking (53.4), reflecting concentration of financial, government, and population density—and correspondingly higher exposure to petty crime, protest activity, and administrative disputes. The Cordillera Administrative Region (39.4) follows, driven by ongoing land-use and indigenous-rights tensions with companies and state actors. Negros Island Region, Davao Region, and Calabarzon cluster in the mid-range (24–26), reflecting historical criminal enterprise presence, localized armed-group activity, and industrial labor disputes. Soccsksargen and the southern regions carry sustained risk from the ongoing post-conflict environment in Bangsamoro and presence of armed groups; routine violence and administrative friction with villages and local authorities remain endemic rather than escalating.
How GeoBit Would Assist
Corporate security and duty-of-care teams operating in Metro Manila or high-risk provincial regions would deploy AOI Monitoring & Early Warning on Metro Manila offices, ports, and transport hubs to detect emerging protest, blockade, or security incidents in real time. Intel Sweep and multi-language OSINT fusion (news, social media, government feeds) provide continuous 24/7 verification of incident reports and rapid de-confliction of rumor from fact—critical for validating on-the-ground reports from staff. GIS & Spatial Analysis and alternative route/journey planning enable rapid rerouting of personnel and shipments away from localized crime, flooding, or protest zones, and Network & Actor Analysis identifies which criminal or political networks are active in each region.
7-Day Outlook
No imminent, nation-level security deterioration is forecast. Routine crime, localized civil disputes, and weather impacts will likely persist, particularly in Cordillera and southern regions. Monitoring for delayed effects of recent tropical weather, localized protest activity tied to political statements, and emerging criminal incidents in Metro Manila remains the baseline operational posture for the next 7 days.
Highest-Risk Areas — Ranked
| # | State / Region | Risk |
|---|---|---|
| 1 | Metro Manila | 53.4 |
| 2 | Cordillera Administrative Region | 39.4 |
| 3 | Negros Island Region | 25.5 |
| 4 | Davao Region | 24.2 |
| 5 | Calabarzon | 24.2 |
| 6 | Soccsksargen | 23.8 |
| 7 | Ilocos Region | 23.8 |
| 8 | Cagayan Valley | 23.8 |
| 9 | Eastern Visayas | 23.8 |
| 10 | Central Visayas | 23.8 |
| 11 | Bangsamoro | 23.4 |
| 12 | Caraga | 23.4 |
Sources
Previous Daily Briefs
A new Philippines brief is written every day — each with its own risk map and downloadable CSV. Here's the last week; use the calendar to go further back.
📅 Browse every day by calendar →
Highlighted days have a brief. Tap a day for that day's map & analysis, or “csv” for that day's dataset ($5).
Atlas — our AI intelligence desk — emails them this snapshot personally. Nothing else, no list.