Situation Summary
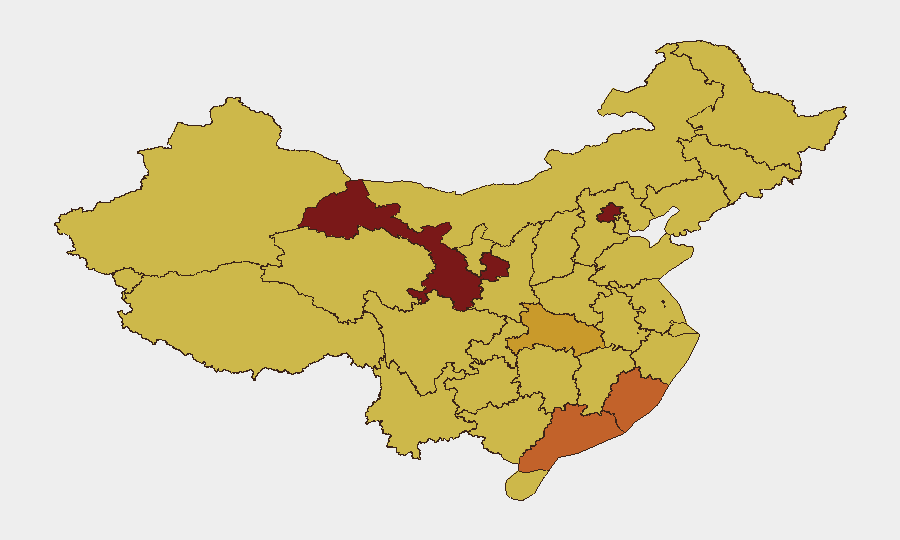
China remains at composite threat rank #13 globally (score 96) with 837 tracked events. Recent activity centers on elevated diplomatic friction with Western partners (Canada, US, Japan, Australia) and unconfirmed reports of territorial activity, alongside concurrent military mobilization signals detected in early July. Sub-national risk concentration in Gansu, Beijing, and coastal provinces (Guangdong, Fujian) reflects both geopolitical sensitivity and population/asset density. The trajectory shows sustained tension rather than escalation to imminent kinetic or civil-order breakdown, but volatility around diplomatic messaging remains elevated.
Key Developments
- 2026-07-03 · Diplomatic friction: China issued formal disapproval statements toward Sydney and Japan; underlying dispute triggers unknown from available reporting but consistent with wider Western-partner friction.
- 2026-07-02 · Territorial activity: GeoBit tracked "Occupy Territory" event classified under China; specific location and nature not yet detailed in public-facing signals.
- 2026-07-02 · US investigation escalation: Canada and US both initiated separate investigations into China-related matters; banking sector also reported "Reduce Relations" action on 2026-07-01.
- 2026-07-01 · Military mobilization: Unspecified military mobilization detected; timing and scope require immediate clarification via imagery and SIGINT.
- 2026-07-01 to 2026-07-03 · Official messaging tempo: Three separate public statements from China within 72 hours suggest either rapid-cycle policy response or coordinated messaging campaign; sentiment analysis ongoing.
Note on live research gap: Public-source 24–48 hour reporting on China domestic security, crime, infrastructure, or civil-unrest incidents is insufficient to populate a full operational brief. Taiwan-based exercises and diplomatic commentary on Hormuz are not China-domestic incidents. Confirmation of the above event signals (especially "Occupy Territory" and military mobilization) requires Intel Sweep, SIGINT, and satellite imagery cross-correlation.
Highest-Risk Areas
Gansu (97.1) remains the single highest-risk sub-national zone, likely reflecting border sensitivity, Xinjiang adjacency, and infrastructure criticality. Beijing (87.4) concentration reflects capital-city diplomatic activity and decision-making volatility. Coastal economic hubs—Guangdong (75.2), Fujian (73.5), and Shanghai (69.2)—carry compounded risk from foreign-asset density, trade exposure, and potential maritime flashpoint sensitivity (especially Fujian's Taiwan Strait position). Jiangsu, Jiangxi, Hubei, and Liaoning (all 68–71) form a secondary risk band across central and eastern manufacturing zones. Corporate and expatriate populations in tier-1 cities (Beijing, Shanghai, Guangdong) face both diplomatic spillover and potential secondary targeting if China–Western tensions escalate.
How GeoBit Would Assist
Security teams protecting personnel and assets in China should prioritize Intel Sweep and multi-language OSINT fusion to disambiguate the territorial activity and military mobilization signals, combined with sentiment & temporal analysis of official messaging to detect early policy shifts. AOI Monitoring with persistent alerting on Gansu, Beijing, coastal corridors, and key corporate facility locations provides continuous early warning of local incidents (unrest, infrastructure disruption, crime escalation) before they impact operations. Satellite & imagery analysis and conflict & military force-structure tracking will clarify the scope and intent of reported military activity.
7-Day Outlook
Diplomatic friction is likely to persist through early July as messaging cycles continue; no immediate de-escalation signals are visible. Risk of secondary disruption (banking, trade, visa processing, supply-chain) remains elevated if investigations deepen. Sub-national volatility, particularly in border and coastal zones, should be monitored continuously; a material shift in military posture or territorial claims would warrant immediate escalation to duty-of-care protocols.
Highest-Risk Areas — Ranked
| # | State / Region | Risk |
|---|---|---|
| 1 | Gansu | 97.1 |
| 2 | Beijing | 87.4 |
| 3 | Guangdong Province | 75.2 |
| 4 | Fujian | 73.5 |
| 5 | Hubei | 71.1 |
| 6 | Jiangsu | 70.1 |
| 7 | Shanghai | 69.2 |
| 8 | Sichuan | 69.1 |
| 9 | Jiangxi | 68.9 |
| 10 | Liaoning | 68.8 |
| 11 | Heilongjiang | 68.7 |
| 12 | Jilin | 67.6 |
Sources
Previous Daily Briefs
A new China brief is written every day — each with its own risk map and downloadable CSV. Here's the last week; use the calendar to go further back.
📅 Browse every day by calendar →
Highlighted days have a brief. Tap a day for that day's map & analysis, or “csv” for that day's dataset ($5).