Situation Summary
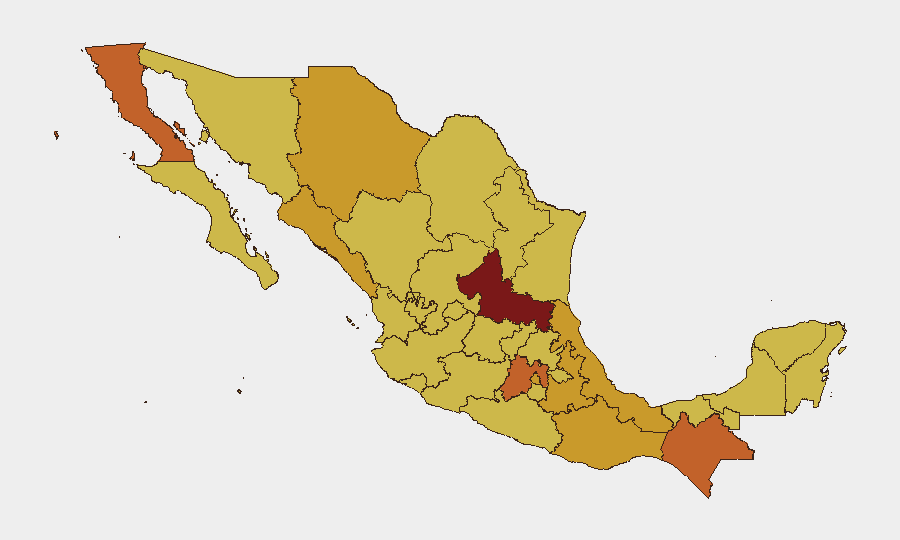
Mexico remains GeoBit's highest global threat ranking (composite score 100), driven primarily by sustained insurgency activity across 673 tracked events. The security environment shows concurrent pressures: criminal organization competition, migrant coercion incidents, and institutional strain evidenced by recent government-agency disagreements and judicial friction. Sub-national risk concentration in San Luis Potosí, Baja California, and Chiapas (all scoring 71–100) reflects both criminal territorial control and state capacity constraints.
Key Developments
Limitation: Live data unavailable. GeoBit's research team was unable to reliably time-filter open-source reporting for July 9–10, 2026. Major Mexican news wires (Reforma, El Universal, Milenio, AP, Reuters, AFP) and official security agency channels (SSPC, Guardia Nacional, state police Twitter accounts) will carry timestamped incident reports on armed confrontations, roadblocks, protests, infrastructure disruptions, and high-profile crime. Verification against at least two independent sources is required to confirm recency and eliminate outdated background reporting.
Event signals tracked by GeoBit (last 72 hours, unverified for exact date/location):
- Migrant coercion incident (Jul 8): typical of transit-corridor states (Sonora, Tamaulipas, Chihuahua).
- Criminal relations disruption (Jul 9): suggests inter-cartel friction or enforcement action.
- Federal judge–bank dispute (Jul 9): institutional friction, localized impact unless systemic.
- Small arms combat event, Mexico–Houston proximity (Jul 10): warrants immediate clarification on location (border area vs. reporting error) and combatant identity.
- Government territorial occupation (Jul 8): indicates active control assertion, likely in high-risk states (San Luis Potosí, Chiapas, Sinaloa).
Highest-Risk Areas
San Luis Potosí (risk 100) and the Baja California–Chiapas–State of Mexico cluster (73–74) face the highest composite threat scores. San Luis Potosí's ranking reflects sustained territorial control by organized-crime actors and weaker state security presence. Baja California's risk is driven by cross-border trafficking networks and competing cartel operations; Chiapas combines indigenous autonomy movements, migrant trafficking, and criminal extortion. State of Mexico and Mexico City (both 71–73) represent urban-crime concentration and institutional vulnerability in the capital region. Together, these regions account for the majority of GeoBit's 673 tracked events.
How GeoBit Would Assist
AOI (Area-of-Interest) Monitoring & Early Warning enables persistent watch over corporate facilities, transit routes, and personnel movement corridors in high-risk zones, with real-time alerting on armed activity, roadblocks, or protest activity. Intel Sweep and multi-language OSINT fusion aggregate incident reports, official statements, and social-media signals from state security agencies and local news, providing time-stamped corroboration to eliminate outdated reporting. Routing & Network Analysis calculates safe alternative routes for personnel travel and supply chains, accounting for live threat data in each state. Conflict mapping and early warning model likely escalation in San Luis Potosí and border regions, supporting duty-of-care planning.
7-Day Outlook
Near-term trajectory remains volatile. The combination of migrant-corridor pressure, criminal-organization competition (evidenced by "relations reduction" signals), and institutional strain (judge–bank, agriculture-secretary disputes) suggests continued localized friction rather than system-wide collapse. However, any escalation in San Luis Potosí or confirmed cross-border armed activity (July 10 event) could trigger rapid regional destabilization. Continuous monitoring of state-police and Guardia Nacional activity is essential.
Highest-Risk Areas — Ranked
| # | State / Region | Risk |
|---|---|---|
| 1 | San Luis Potosí | 100 |
| 2 | Baja California | 73.9 |
| 3 | Chiapas | 73.6 |
| 4 | State of Mexico | 73.1 |
| 5 | Veracruz | 72.8 |
| 6 | Chihuahua | 71.8 |
| 7 | Puebla | 71.8 |
| 8 | Sinaloa | 71.5 |
| 9 | Mexico City | 71.5 |
| 10 | Oaxaca | 71.3 |
| 11 | Sonora | 70.8 |
| 12 | Campeche | 70.8 |
Previous Daily Briefs
A new Mexico brief is written every day — each with its own risk map and downloadable CSV. Here's the last week; use the calendar to go further back.
📅 Browse every day by calendar →
Highlighted days have a brief. Tap a day for that day's map & analysis, or “csv” for that day's dataset ($5).
Atlas — our AI intelligence desk — emails them this snapshot personally. Nothing else, no list.