Situation Summary
New Zealand faces an elevated acute security environment characterised by a sharp cluster of serious violent crime, armed incidents, and critical infrastructure compromise within the past 24 hours. Wellington and Otago regions drive the composite threat ranking (both 31.3), driven by violent robbery, armed assault, and firearms-related offences in Lower Hutt and the Manawatū corridor. A concurrent healthcare sector cyberattack affecting patient data compounds operational and reputational risk across the healthcare system. The trajectory suggests sustained volatility rather than isolated incidents.
Key Developments
- Lower Hutt, Wellington – 22 July 0500hrs: Three intruders arrested following a home invasion involving kidnapping, aggravated robbery, and vehicle theft; offenders apprehended within one hour in Moera.
- Whangaehu/Foxton, Manawatū – 22 July 1150hrs to 1530hrs: Armed police manhunt following a serious assault leaving victim in critical condition; suspect arrested near Foxton Golf Club; charges under consideration.
- Central Wellington (Wakefield Street/Kent Terrace) – 22 July 1350hrs: Commercial burglary involving firearm display; suspect apprehended on Kent Terrace with imitation firearm and discarded clothing recovered; firearms-related charges likely.
- Auckland Airport – 22 July 0940hrs: Restricted-area breach by 42-year-old male; arrests for endangering transport, wilful damage, and dangerous driving; aviation security response activated; defendant due in Manukau District Court.
- New Zealand healthcare sector – 22 July (disclosure date): Major healthcare services network confirmed cyberattack on 23 June resulting in theft of patient personal medical records; patient notification completed; data-privacy and regulatory compliance risk elevated.
Highest-Risk Areas
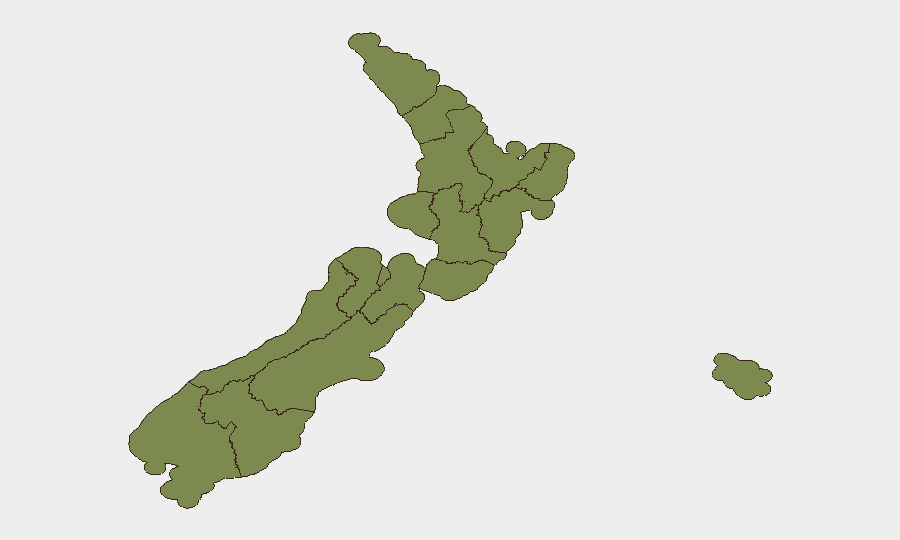
Wellington (31.3) and Otago (31.3) jointly present the highest risk, driven primarily by violent crime concentrations in the Wellington metropolitan area (Lower Hutt, central Wellington) and surrounding Manawatū corridor. Auckland (26.3) follows, reflecting transit-hub vulnerabilities highlighted by the airport security breach. Canterbury (20.8) remains elevated. These four regions account for the majority of the 107 tracked events; violent robbery, armed assault, and critical infrastructure targeting (aviation, healthcare) characterise the threat profile. Lower-risk regions (Northland, Taranaki, Manawatū-Whanganui, Tasman <3 composite score) suggest risk concentration rather than dispersed national instability.
How GeoBit Would Assist
Corporate security teams should deploy AOI Monitoring & Early Warning on Wellington CBD, Lower Hutt, and Auckland Airport to generate real-time alerts on violent-crime and breach events affecting personnel or facilities. Multi-language OSINT (X/Twitter, Telegram) and sentiment analysis of resident and police communications in high-risk regions provides early signal of escalating community tension or offender activity. Network & Actor Analysis applied to the healthcare cyberattack (attribution, threat-actor motive, payload staging) supports incident response and risk-mitigation planning for organisations holding patient or sensitive corporate data.
7-Day Outlook
Violence and property crime intensity is likely to remain elevated through the week absent significant operational intervention; police resourcing and judicial outcomes in the four headline cases will signal trajectory. Healthcare sector cyber-incident management and potential regulatory scrutiny should be assumed to persist. Auckland Airport operations warrant continued monitoring for secondary security breaches or copycat incidents.
Highest-Risk Areas — Ranked
| # | State / Region | Risk |
|---|---|---|
| 1 | Wellington | 31.3 |
| 2 | Otago | 31.3 |
| 3 | Auckland | 26.3 |
| 4 | Canterbury | 20.8 |
| 5 | West Coast | 11.3 |
| 6 | Southland | 5.8 |
| 7 | Bay of Plenty | 4 |
| 8 | Waikato | 3.5 |
| 9 | Northland | 2.6 |
| 10 | Taranaki | 2.6 |
| 11 | Tasman | 2.2 |
| 12 | Manawatū-Whanganui | 1.7 |
Previous Daily Briefs
A new New Zealand brief is written every day — each with its own risk map and downloadable CSV. Here's the last week; use the calendar to go further back.
📅 Browse every day by calendar →
Highlighted days have a brief. Tap a day for that day's map & analysis, or “csv” for that day's dataset ($5).
Atlas — our AI intelligence desk — emails them this snapshot personally. Nothing else, no list.