Situation Summary
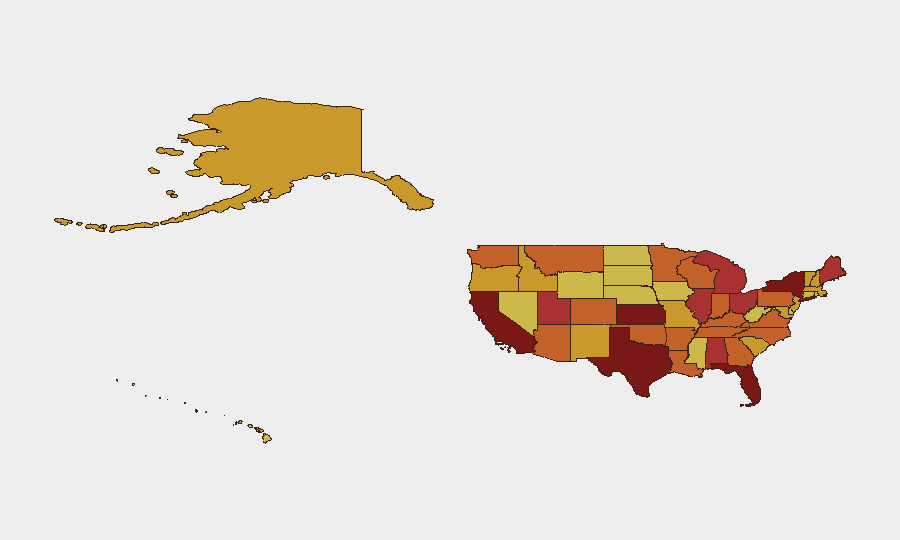
The United States maintains a composite threat score of 99 (global rank #11) with 6,463 tracked events, reflecting elevated but regionally concentrated risk. Texas, California, and New York dominate the sub-national ranking, collectively accounting for the highest exposure across unconventional violence, territorial occupation, armed conflict, and civil demonstration. Current trajectory shows sustained civil-unrest activity and isolated armed incidents, with no indication of nationwide system failure or coordinated campaign.
Key Developments
- 2026-07-08 · Houston, Texas · Small Arms Combat: Armed confrontation reported between Houston actors and Mexican-affiliated entities; nature and casualty status unconfirmed. Indicates cross-border tension spillover into major metropolitan center.
- 2026-07-09 · California (intra-state) · Demonstrate/Rally: Student and community-led demonstrations underway across California; links to policy rejection or resource disputes under investigation.
- 2026-07-09 · California · Arrest/Detain: Police operations resulted in arrests; operational context and trigger event still being clarified.
- 2026-07-07 · Maine · Occupy Territory: Territorial occupation reported in Maine; dispute framing (land access, resource, sovereignty-related) requires field confirmation.
- 2026-07-08 · Federal Level · Reject: Federal judge rejected government action; legal and policy implications remain in flux and may trigger secondary civil response.
- 2026-07-07 · Unconventional Violence (multi-state): Associated Press coverage of unconventional violence incident(s); full scope and affected jurisdictions still developing.
Note: Web research over the last 24–48 hours did not yield additional granular U.S. domestic event data; event set above relies on GeoBit event signals and requires field or source corroboration for operational risk assessment.
Highest-Risk Areas
Texas (99.5) leads all states, driven by armed confrontation in Houston and earlier unconventional-violence signals since early July. California (91.8) and New York (90.9) follow, with California showing active civil unrest and arrest activity; both states harbor persistent protest infrastructure and demographic density that amplifies cascading risk. Kansas (85.4) and Florida (83.1) round the top five, though specific recent triggers are not yet visible in current event feed. The concentration in Texas and California suggests either geographically localized flashpoints (cross-border violence in Texas; resource or political unrest in California) or data-collection artifacts; Maine's territory-occupation signal warrants field verification.
How GeoBit Would Assist
Security teams would deploy AOI (Area-of-Interest) Monitoring & Early Warning against Texas (Houston metro), California urban corridors, and Maine to detect escalation or secondary mobilization in real time. OSINT fusion (X/Twitter, news feeds, multi-language sources, entity extraction) would corroborate event signals, separate rumor from confirmed activity, and identify actor networks behind demonstrations and armed incidents. Network & Actor Analysis would map relationships between Houston actors, Mexican-affiliated groups, and downstream supply-chain or asset-protection implications for corporate operations in affected zones.
7-Day Outlook
No force-multiplier events (national policy shifts, coordinated actor campaigns, or infrastructure strikes) have emerged; risk is expected to remain regionally concentrated in Texas, California, and New York. Texas armed-incident trajectory and California civil-unrest duration should be monitored for contagion into adjacent states or federal response escalation. Personnel and asset managers in these three states should assume elevated posture through mid-July pending legal or policy resolution on the federal judge's rejection and state-level occupation outcome.
Highest-Risk Areas — Ranked
| # | State / Region | Risk |
|---|---|---|
| 1 | Texas | 99.5 |
| 2 | California | 91.8 |
| 3 | New York | 90.9 |
| 4 | Kansas | 85.4 |
| 5 | Florida | 83.1 |
| 6 | Maine | 78.4 |
| 7 | Ohio | 78 |
| 8 | Alabama | 77 |
| 9 | Michigan | 76.8 |
| 10 | Utah | 76.7 |
| 11 | Illinois | 76.4 |
| 12 | Minnesota | 75.5 |
Sources
Previous Daily Briefs
A new United States brief is written every day — each with its own risk map and downloadable CSV. Here's the last week; use the calendar to go further back.
📅 Browse every day by calendar →
Highlighted days have a brief. Tap a day for that day's map & analysis, or “csv” for that day's dataset ($5).
Atlas — our AI intelligence desk — emails them this snapshot personally. Nothing else, no list.