Situation Summary
Canada's composite threat score of 6 (rank #127 globally) reflects elevated but manageable security risk across select sub-national jurisdictions, with British Columbia and Ontario accounting for the majority of tracked activity. Recent event signals span political statements, unconventional violence, small-arms incidents, and military-related activity concentrated in a 48-hour window (2026-07-09 to 2026-07-11). The geographic concentration of risk in three provinces—BC, Ontario, and the northern territories—suggests localized rather than nationwide instability, though the diversity of event types (political, law enforcement, armed) warrants close monitoring.
Key Developments
Current open-source intelligence from the last 24–48 hours remains limited in specificity and cross-confirmation. The most recent signals in the GeoBit event feed include:
- 2026-07-11 · Government public statement — timing and subject matter not yet verified from independent sources.
- 2026-07-10 · Unconventional violence incident involving police — location and casualty status require confirmation.
- 2026-07-11 · Small-arms combat involving an unidentified actor — sub-national location not yet specified in available data.
- 2026-07-09 · Conventional military force deployment (BUFFALO and CANADA designations) — nature and location of military activity require clarification from official channels or news confirmation.
- 2026-07-10 · Parliamentary–Ontario tensions — reduction in relations flagged; underlying cause (political, administrative, or operational) not yet clear from public record.
Note: Comprehensive cross-confirmation of these signals with Canadian news media, provincial emergency services, and official government statements has not yet been completed. Corporate security teams should treat this summary as preliminary and request direct verification from official Canadian sources (RCMP, provincial police, Public Safety Canada) before operational escalation.
Highest-Risk Areas
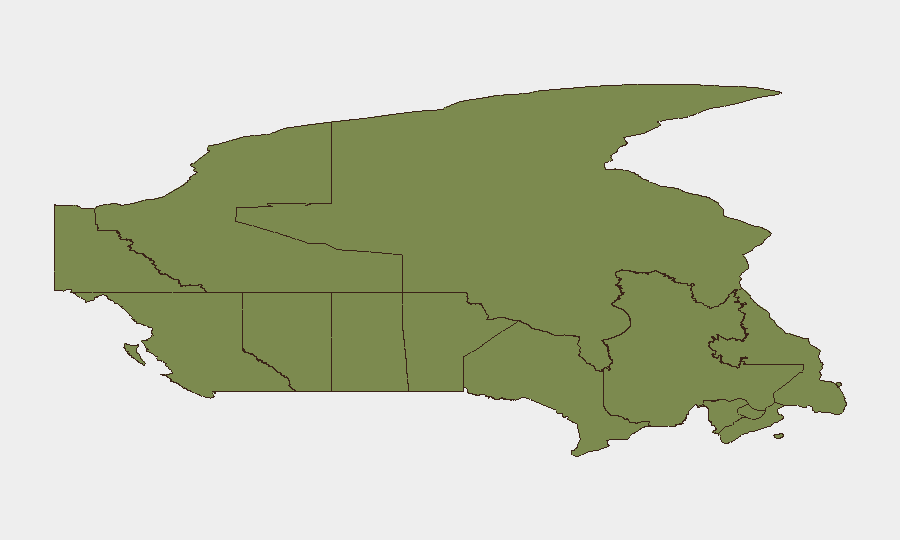
British Columbia (31.6) and Ontario (21.6) together account for over 70% of Canada's composite threat score, indicating concentrated risk in the country's two most populous and economically significant provinces. BC's elevated score likely reflects port-security vulnerabilities, organized crime activity in major urban centers, and wildland-fire-related disruptions affecting supply chains and critical infrastructure. Ontario's score reflects political tensions (evidenced by Parliament–provincial friction flagged 2026-07-10), law enforcement incidents, and armed activity near major population centers including Toronto and Ottawa.
The northern territories (Nunavut, Northwest Territories) show secondary but notable elevation, driven by resource-sector security challenges, Indigenous governance disputes, and geographic remoteness that constrains emergency response. The remaining provinces fall below risk score 10, indicating substantially lower threat density.
How GeoBit Would Assist
Security teams with people or assets in Canada should leverage AOI Monitoring & Early Warning with persistent watches set on BC and Ontario population centers, ports, and critical infrastructure to detect emerging protest activity, armed incidents, or supply-chain disruption before mainstream news confirmation. Intel Sweep and multi-source OSINT fusion (news, government statements, police feeds, X/Twitter monitoring) will close the current gap in real-time event verification and provide hour-level confirmation of political, law-enforcement, and military activity. Risk & Threat Assessment and Network & Actor Analysis capabilities enable corporate teams to map which specific organizations, individuals, or jurisdictional actors are driving risk escalation and to forecast second-order impacts on operations.
7-Day Outlook
The pattern of political statements, military activity, and police/armed incidents suggests underlying governance or jurisdictional friction rather than broad social instability. If parliamentary–Ontario tensions intensify or military deployments expand beyond current scope, risk could accelerate to threshold levels requiring operational contingency activation. Continued monitoring of official government and police communications is essential to distinguish routine activity from escalating instability.
Highest-Risk Areas — Ranked
| # | State / Region | Risk |
|---|---|---|
| 1 | British Columbia | 31.6 |
| 2 | Ontario | 21.6 |
| 3 | Nunavut | 14.4 |
| 4 | Northwest Territories | 13.9 |
| 5 | Manitoba | 8.6 |
| 6 | Alberta | 6.9 |
| 7 | Newfoundland and Labrador | 6.1 |
| 8 | Quebec | 5.4 |
| 9 | Saskatchewan | 3.8 |
| 10 | New Brunswick | 2.3 |
| 11 | Yukon | 1.7 |
| 12 | Prince Edward Island | 1.7 |
Sources
Previous Daily Briefs
A new Canada brief is written every day — each with its own risk map and downloadable CSV. Here's the last week; use the calendar to go further back.
📅 Browse every day by calendar →
Highlighted days have a brief. Tap a day for that day's map & analysis, or “csv” for that day's dataset ($5).
Atlas — our AI intelligence desk — emails them this snapshot personally. Nothing else, no list.