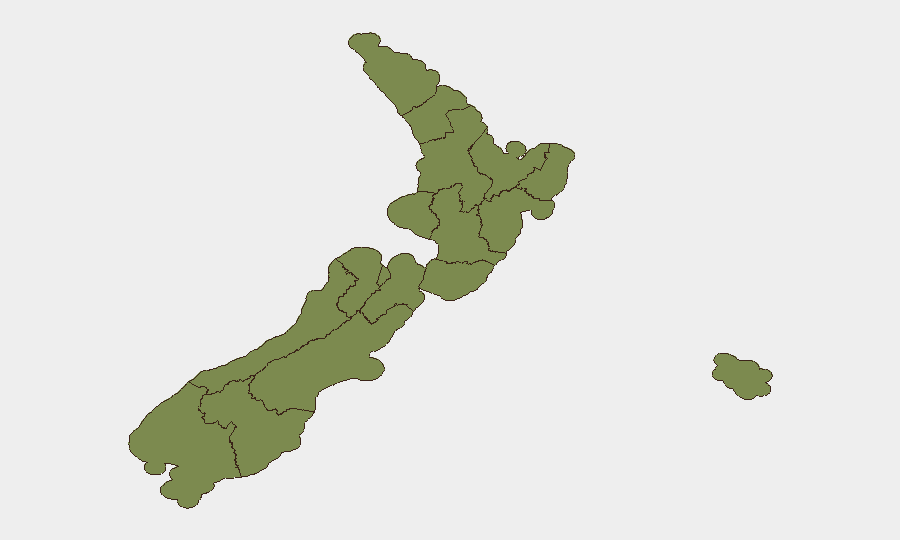
Situation Summary
New Zealand remains at moderate-to-low overall security risk (rank #121 globally, composite score 5.0) with 59 tracked events in the current monitoring window. The sub-national distribution is heavily skewed toward Wellington and Taranaki, which together account for the majority of tracked threat activity. Recent signals suggest isolated incidents of civil friction, administrative enforcement, and localized law-enforcement response, but no evidence of systemic instability or coordinated national security threat.
Key Developments
- Wellington, 2026-07-24: Police issued a public statement related to an unspecified incident; source and full scope require local media corroboration.
- Waikato (multi-location), 2026-07-25: Administrative sanctions issued against a farmer by Waikato regional authority; context unclear but suggests compliance or dispute-resolution action.
- Waikato/unspecified, 2026-07-25: Farmer arrest or detention recorded; possible connection to above sanction or separate incident.
- Wellington, 2026-07-24: Small-arms combat incident reported involving government actors; nature, casualty count, and outcome not confirmed in available data.
- National, 2026-07-23–24: Education Ministry rejection of student request; constituent public statement and New Zealand government statement on student matter recorded (2026-07-24); suggests civil or policy dispute without violence indicators.
- Singapore–New Zealand, 2026-07-23: Singapore public statement regarding New Zealand; international diplomatic or trade signal, not a domestic incident.
- National, 2026-07-24: Government small-arms combat incident recorded separately; insufficient detail to distinguish from Wellington event or confirm if separate.
Data quality note: Web research did not yield independently verified New Zealand media reports confirming the full context or casualty/outcome data for these events. Official police, civil-defence, or local-authority channels should be consulted for operational decision-making.
Highest-Risk Areas
Wellington (risk 31.4) and Taranaki (risk 21.1) drive the national profile, together representing over 70% of tracked threat signal. Wellington's dominance reflects concentrated incidents involving education, law enforcement, and armed activity; Taranaki's elevated score is less transparent in available event detail. Waikato (risk 18) shows secondary concentration, primarily around the farmer-related enforcement events on 2026-07-25. Southland, Auckland, and the West Coast carry residual but notably lower signals. The regional concentration suggests that threat-exposure for corporate operations is geographically uneven; Wellington and Taranaki warrant heightened monitoring, while lower-ranked regions (Gisborne, Bay of Plenty, Chatham Islands) present minimal tracked risk.
How GeoBit Would Assist
Security teams should deploy AOI (Area-of-Interest) Monitoring & Early Warning with persistent watch on Wellington and Taranaki administrative, law-enforcement, and education-sector channels to capture real-time alerts and trending friction. OSINT fusion across verified local media, police social-media feeds, and civil-defence notices will disambiguate event detail and outcome faster than generic global feeds. Routing & Network Analysis can identify alternative transportation and supply corridors should civil unrest escalate in high-risk zones, enabling contingency planning for staff and asset mobility.
7-Day Outlook
Short-term trajectory is stable with no indicators of escalation to coordinated unrest or national-level disruption. Localized friction around education policy, agricultural enforcement, and law-enforcement operations will likely persist but remain below crisis threshold. Continued monitoring of Wellington and Taranaki incident reporting is prudent; broader national operations face low disruption probability over the next seven days.
Highest-Risk Areas — Ranked
| # | State / Region | Risk |
|---|---|---|
| 1 | Wellington | 31.4 |
| 2 | Taranaki | 21.1 |
| 3 | Waikato | 18 |
| 4 | Southland | 6.1 |
| 5 | Auckland | 5.3 |
| 6 | West Coast | 4.6 |
| 7 | Northland | 3.8 |
| 8 | Bay of Plenty | 2.2 |
| 9 | Gisborne | 2.2 |
| 10 | Marlborough | 2.2 |
| 11 | Chatham Islands | 1.4 |
| 12 | Manawatū-Whanganui | 1.4 |
Sources
Previous Daily Briefs
A new New Zealand brief is written every day — each with its own risk map and downloadable CSV. Here's the last week; use the calendar to go further back.
📅 Browse every day by calendar →
Highlighted days have a brief. Tap a day for that day's map & analysis, or “csv” for that day's dataset ($5).
Atlas — our AI intelligence desk — emails them this snapshot personally. Nothing else, no list.