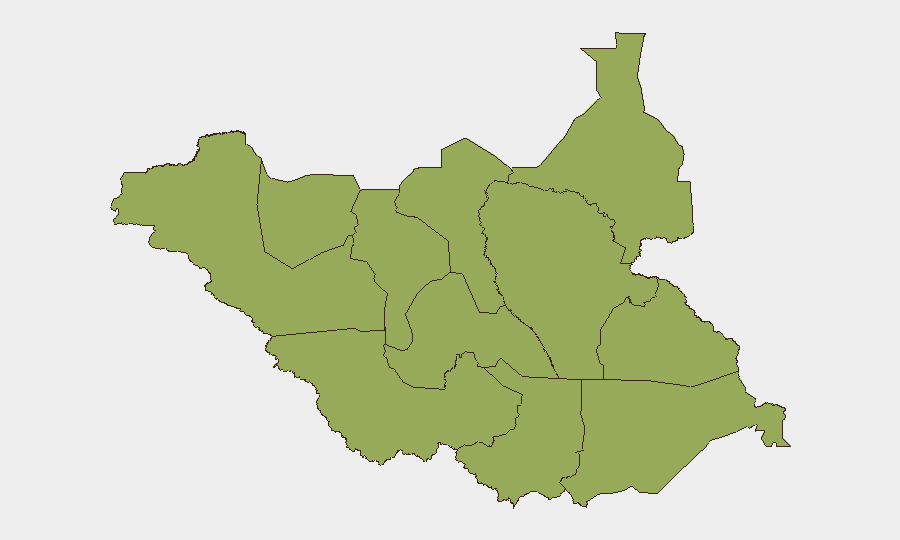
Situation Summary
South Sudan remains at composite threat rank #29 globally, driven primarily by ongoing ethnic violence and civil conflict. No discrete security incidents have been verified in the last 24–48 hours across open-source monitoring channels. The country's sub-national risk landscape is notably uniform, with twelve states and administrative areas each holding identical composite risk scores of 47, indicating structural, distributed instability rather than localized acute crisis.
Key Developments
No verified South Sudan–specific security incidents have been documented in the 24–48 hour window ending 31 July 2026. Recent open-source and social-media monitoring, including X/Twitter and humanitarian data feeds, contain no timestamped discrete events for South Sudan in this period. Available conflict trackers and OSINT sources explicitly note an absence of new tracked incidents for the current observation window. This absence of acute triggering events does not indicate reduced underlying risk; rather, it reflects a period of relative reporting quiet amid persistent structural tensions. Historical context: The country experienced significant civilian displacement in early 2026 (Manyang, Bahr el Ghazal) and ongoing inter-communal and armed-group activity throughout the year, but no new incidents have been confirmed since the most recent 48-hour cycle.
Highest-Risk Areas
All twelve tracked South Sudan administrative divisions—Upper Nile, Northern and Western Bahr el Ghazal, Ruweng, Unity, Warrap, Lakes, Jonglei, Greater Pibor, and the three Equatoria states—carry identical risk scores (47), reflecting nationwide distribution of ethnic, communal, and organized armed-group activity rather than concentration in a single high-risk zone. This uniform scoring indicates that security and duty-of-care teams should apply heightened vigilance across the entire country rather than assume safer corridors in any particular state. Jonglei and Unity have historically been focal points for intercommunal violence and militia activity; Upper Nile and the Bahr el Ghazal regions remain vulnerable to displacement and resource-competition drivers. The absence of geographic variance in risk rankings underscores the systemic nature of South Sudan's conflict environment.
How GeoBit Would Assist
Corporate security and risk teams with personnel or assets in South Sudan should employ AOI Monitoring & Early Warning for facility-level and regional persistent watch with automated alerting on emerging incidents in their operational footprint. Intel Sweep and OSINT fusion (X/Twitter, Telegram, YouTube, multi-language sources, entity extraction) provide real-time signal aggregation across distributed conflict actors and ethnic networks. Battle mapping and force-structure tracking enable situational awareness of armed-group positions and movement, while GIS & Spatial Analysis supports route planning and avoidance of high-activity zones. Regular Conflict & Risk Assessment updates calibrate threat exposure as the 24–48 hour cycle evolves.
7-Day Outlook
The near-term outlook remains characterized by low discrete-event reporting coupled with persistent structural risk across all administrative regions. No triggering incidents or significant policy shifts are evident from current monitoring; however, the uniform high sub-national risk profile suggests that localized violence or displacement could emerge with minimal warning. Security teams should maintain standard heightened protocols and active monitoring posture rather than adjust based on current reporting quiet.
Highest-Risk Areas — Ranked
| # | State / Region | Risk |
|---|---|---|
| 1 | Upper Nile | 47 |
| 2 | Northern Bahr el Ghazal | 47 |
| 3 | Western Bahr el Ghazal State | 47 |
| 4 | Ruweng Administrative Area | 47 |
| 5 | Unity | 47 |
| 6 | Warrap | 47 |
| 7 | Lakes | 47 |
| 8 | Jonglei | 47 |
| 9 | Greater Pibor Administrative Area | 47 |
| 10 | Western Equatoria | 47 |
| 11 | Central Equatoria | 47 |
| 12 | Eastern Equatoria | 47 |
Sources
Previous Daily Briefs
A new South Sudan brief is written every day — each with its own risk map and downloadable CSV. Here's the last week; use the calendar to go further back.
📅 Browse every day by calendar →
Highlighted days have a brief. Tap a day for that day's map & analysis, or “csv” for that day's dataset ($5).
Atlas — our AI intelligence desk — emails them this snapshot personally. Nothing else, no list.