Situation Summary
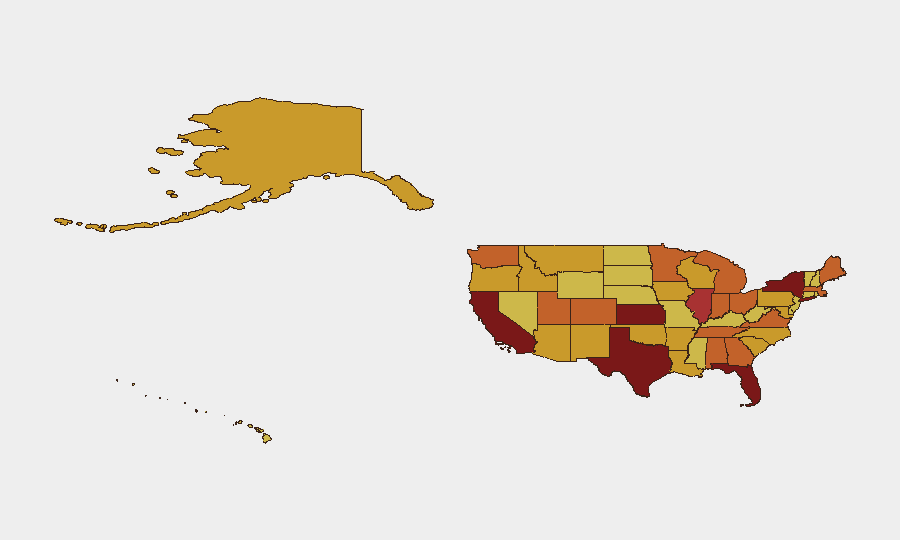
The United States ranks #11 globally in composite threat score (99/100), with 6,870 tracked events reflecting elevated civil unrest, street-level violence, and protest activity across major metropolitan areas. The past 48 hours have seen concentrated incidents of armed violence, organized retail theft, police–protester friction, and public-order disruptions spanning Texas, California, Georgia, Oregon, New York, Illinois, and Michigan. Risk remains geographically dispersed rather than concentrated in a single region, but Texas, California, and Kansas dominate the sub-national ranking, suggesting sustained pressure points across energy infrastructure, population density, and institutional flashpoints.
Key Developments
- Atlanta, Georgia (July 10) – Large protest and police scuffles outside Fulton County Courthouse during election-related hearing; at least one arrest for disorderly conduct documented on video and social media.
- Portland, Oregon (July 9–10) – Overnight clashes between demonstrators and police in downtown core following police-accountability protest; property damage (broken windows) and unlawful assembly declaration reported.
- Chicago, Illinois (July 10) – Flash-mob retail theft involving 20–30 individuals at Loop apparel store; at least two suspects detained after coordinated merchandise grab-and-flee.
- Los Angeles, California (July 9) – Shooting incident near Hollywood Boulevard involving two vehicles; three injured, street closures during investigation.
- Houston, Texas (July 9) – Multi-victim shooting at southwest neighborhood bar; four shot (one critically), incident assessed as targeted rather than random.
- New York City, New York (July 10) – Suspicious unattended vehicle in Times Square triggered bomb-squad response and partial area evacuation; vehicle cleared after ~1 hour, area reopened.
- Detroit, Michigan (July 10) – Substation equipment failure caused power outages across west-side neighborhoods; opportunistic vandalism and traffic disruption at darkened intersections reported.
- Washington, D.C. (July 10) – Heightened Capitol security and street closures due to demonstration over foreign policy and military actions; no serious incidents but temporary access restrictions.
Highest-Risk Areas
Texas (99.2) and California (90.4) anchor the top tier, reflecting high-frequency armed violence, organized property crime, and large protest movements in major metropolitan corridors. Kansas (86.0) and New York (83.2) follow, suggesting institutional and election-related tensions alongside street-level unrest. Texas's position is driven by concentrated shooting incidents (Houston bar shooting, ongoing firearm assault frequency); California's reflects both organized retail crime networks and protest activity. The ranking indicates risk is not isolated to one region but spread across energy hubs, financial centers, and politically contentious areas, requiring multi-jurisdiction monitoring.
How GeoBit Would Assist
Corporate security teams should deploy Intel Sweep and X/Twitter OSINT to track protest calendars, flash-mob retail networks, and real-time incident confirmation across portfolio locations; AOI Monitoring & Early Warning on highest-risk state capitals and corporate facilities in Texas, California, and Illinois will provide persistent alerting on demonstrations and unauthorized gatherings. Entity extraction and sentiment analysis on protest rhetoric and social-media coordination can flag escalation vectors 24–72 hours ahead of major demonstrations, enabling access-control and duty-of-care adjustments.
7-Day Outlook
Mid-July typically sees sustained protest activity tied to summer recess and holiday scheduling; expect continuation of dispersed street violence and opportunistic retail crime across major metros. Election-related court hearings (particularly in Georgia and Arizona) will likely sustain courthouse-area tensions through late July. No single catastrophic event is imminent, but cumulative friction across police–protester dynamics and firearm violence suggests elevated operational risk for facilities in Texas, California, Georgia, and Illinois through mid-month.
Highest-Risk Areas — Ranked
| # | State / Region | Risk |
|---|---|---|
| 1 | Texas | 99.2 |
| 2 | California | 90.4 |
| 3 | Kansas | 86 |
| 4 | New York | 83.2 |
| 5 | Florida | 80.4 |
| 6 | Illinois | 78.7 |
| 7 | Utah | 75.1 |
| 8 | Alabama | 74.8 |
| 9 | Minnesota | 74.5 |
| 10 | Maine | 74.4 |
| 11 | Indiana | 73.9 |
| 12 | Colorado | 73.6 |
Sources
Previous Daily Briefs
A new United States brief is written every day — each with its own risk map and downloadable CSV. Here's the last week; use the calendar to go further back.
📅 Browse every day by calendar →
Highlighted days have a brief. Tap a day for that day's map & analysis, or “csv” for that day's dataset ($5).
Atlas — our AI intelligence desk — emails them this snapshot personally. Nothing else, no list.