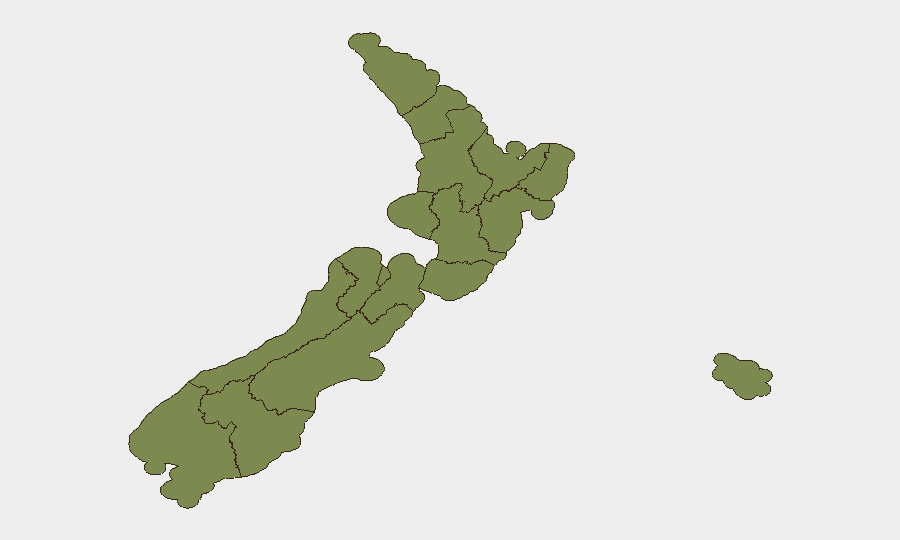
Situation Summary
New Zealand's composite threat score of 17 places it in the lower-middle range globally, but sub-national variation is pronounced: Wellington and Taranaki account for disproportionate risk concentration, while most regions remain comparatively stable. Recent signal activity shows scattered law-enforcement and administrative action across multiple sectors—agriculture, education, and public safety—without evidence yet of coordinated or escalating systemic instability. The overall trajectory remains containable, though Wellington's elevated risk warrants sustained monitoring.
Key Developments
- 2026-07-25, Waikato. Administrative sanctions issued against a farmer by the Waikato regional authority; concurrent arrest/detention of a farmer on 2026-07-25 signals potential agricultural-sector enforcement action or compliance dispute.
- 2026-07-24, Wellington. Small arms combat incident recorded; local police issued a public statement. Nature and casualty status remain unclear from available signals; further detail required.
- 2026-07-24, National. Police issued a public statement on 2026-07-24 (content unspecified in signal metadata); concurrent disapproval action by New Zealand government suggests official response to a specific incident or policy matter.
- 2026-07-23, Education. Ministry of Education rejected a student petition or request; student-related public statement issued by New Zealand government on 2026-07-24. Context unclear; possible education policy or institutional grievance.
- 2026-07-23, Unspecified. Police investigation initiated; mayor issued rejection statement (topic unspecified).
- 2026-07-23, International. Singapore issued a public statement regarding New Zealand—no escalation signals, but cross-border diplomatic statement merits tracking in context.
*Note: Web research did not yield independently time-stamped detail on several recent incidents (Selwyn crash, Christchurch crime spree, airport emergency) sufficient to confirm 24–48-hour window. These are flagged for follow-up.*
Highest-Risk Areas
Wellington's composite risk score of 31.3 dominates the national picture, driven by recent small arms incidents, police and government statements, and apparent institutional friction. Taranaki (21.1) ranks second, though specific drivers are not yet visible in current signal data; sustained monitoring is warranted. Waikato (17.9), despite lower absolute score, has registered both administrative enforcement and arrest action in the past 24 hours, suggesting active operational or compliance activity. Combined, these three regions account for the majority of measurable risk; Auckland, Southland, and remaining areas remain significantly lower-risk.
How GeoBit Would Assist
Intel Sweep and OSINT Fusion would consolidate fragmented signal data into coherent incident narratives, particularly for the Wellington small arms incidents and education-sector disputes. Multi-language entity extraction and network analysis would map relationships between arrested/detained individuals and organizations across agriculture and government, revealing systemic patterns. AOI Monitoring with alerting on Wellington, Taranaki, and Waikato would enable early detection of escalation—protests, further enforcement, or public reaction—allowing duty-of-care teams to adjust personnel posture or asset positioning ahead of deterioration.
7-Day Outlook
No evidence yet of rapid escalation or systemic collapse; near-term trajectory suggests continued administrative and law-enforcement action on specific incidents (agricultural, education, public order) rather than mass mobilization or infrastructure threat. Monitoring for secondary effects—media amplification, public protest, or political response—will be critical to detect if isolated incidents cohere into broader instability. Wellington and Taranaki require daily signal review; most other regions remain stable.
Highest-Risk Areas — Ranked
| # | State / Region | Risk |
|---|---|---|
| 1 | Wellington | 31.3 |
| 2 | Taranaki | 21.1 |
| 3 | Waikato | 17.9 |
| 4 | Auckland | 6.9 |
| 5 | Southland | 6.1 |
| 6 | West Coast | 4.5 |
| 7 | Northland | 3.7 |
| 8 | Bay of Plenty | 2.1 |
| 9 | Gisborne | 2.1 |
| 10 | Marlborough | 2.1 |
| 11 | Chatham Islands | 1.3 |
| 12 | Manawatū-Whanganui | 1.3 |
Sources
Previous Daily Briefs
A new New Zealand brief is written every day — each with its own risk map and downloadable CSV. Here's the last week; use the calendar to go further back.
📅 Browse every day by calendar →
Highlighted days have a brief. Tap a day for that day's map & analysis, or “csv” for that day's dataset ($5).
Atlas — our AI intelligence desk — emails them this snapshot personally. Nothing else, no list.