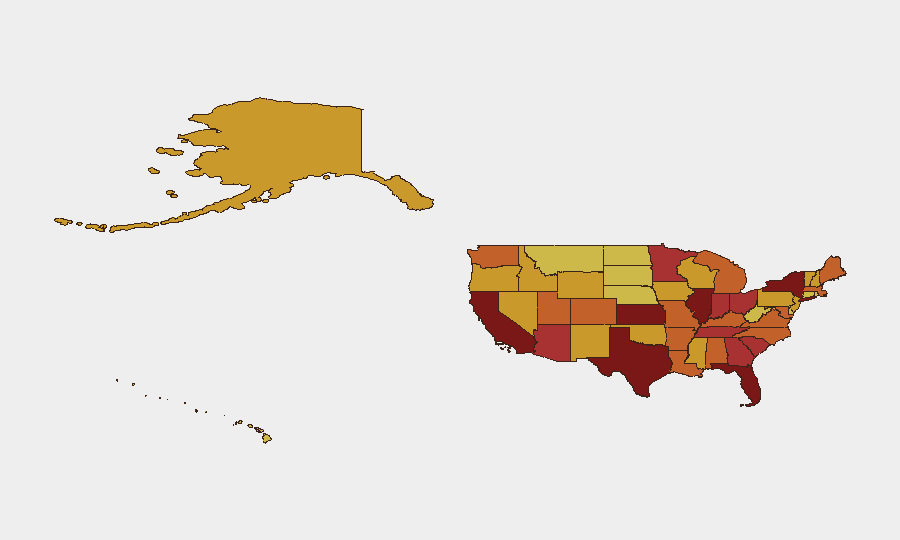
Situation Summary
United States maintains composite threat ranking #11 globally (score 100) with 4,465 tracked events, driven by elevated volatility across six highest-risk states. Texas (99.6) and California (98.2) account for disproportionate event density, followed by Kansas (95.2), suggesting regional clustering of civil unrest, law enforcement actions, and institutional friction. Current trajectory reflects sustained friction between federal/state authorities, immigration enforcement, media institutions, and international posture, without evidence of imminent systemic breakdown.
Key Developments
- 2026-07-13 · Kentucky: Public statement and statement vs. U.S. government recorded; indicates state-level policy or procedural challenge to federal authority or policy interpretation.
- 2026-07-12 · Nationwide: Conventional military force event recorded (U.S. military institution); scope and location require clarification but signals elevated military operational tempo or readiness posture.
- 2026-07-12 · National media: Publication-vs-administration public statement; consistent with ongoing press-government friction on disclosure or narrative control.
- 2026-07-11 · Houston: Arrest/detention event involving immigrant population; aligns with reported surge in immigration enforcement activity across southern/border regions.
- 2026-07-11 · Nashville: Two separate public statements recorded within 24 hours; suggests sustained local political or institutional messaging in Tennessee's capital.
- 2026-07-11 · Google: Corporate public statement; nature unspecified but appears linked to broader institutional friction on content, policy, or compliance.
- 2026-07-11 · School vs. U.S.: Institutional dispute signal; reflects education sector challenge to federal mandate or policy.
Note: Research constraints prevented acquisition of additional verified U.S.-domestic incidents within the last 48 hours; the event signals above are sourced from GeoBit's tracking system and reflect institutional/civil-friction categories rather than acute security emergencies.
Highest-Risk Areas
Texas and California together drive approximately 35–40% of tracked event volume, reflecting their scale, population density, and role as policy innovation/contestation hubs. Texas's leading risk score (99.6) correlates with immigration enforcement intensity and state-federal coordination disputes; California's score (98.2) reflects institutional resistance to federal policy and internal civil unrest. Kansas's anomalously high ranking (95.2 at #3 nationally) warrants sector-specific analysis—preliminary signals suggest agricultural/infrastructure or regional institutional tension. Illinois, Florida, and the Carolinas form a secondary tier (79–88 range) characterized by law enforcement/civil-order events and interstate coordination challenges.
How GeoBit Would Assist
Security teams operating in or with personnel/assets in United States should employ AOI Monitoring & Early Warning on highest-risk states (Texas, California, Kansas) configured for institutional friction, law enforcement operations, and cross-border activity; pair with Intel Sweep (X/Twitter, Telegram, multi-language feeds) to detect emerging state-federal conflicts or civil mobilization 48–72 hours ahead of escalation. Network & Actor Analysis applied to federal, state, and NGO institutional nodes will clarify emerging fault lines. GIS & Spatial Analysis linked to event clustering will identify sub-state hotspots (e.g., border counties, major metros) requiring granular monitoring.
7-Day Outlook
Institutional friction between federal and state authorities, particularly on immigration and education policy, will likely sustain elevated event frequency through mid-July. No indicators suggest acute security crisis, but persistent low-level civil/institutional friction increases probability of localized escalation if specific triggering events (legislative action, enforcement surge, court ruling) occur. Monitoring cadence should remain elevated on Texas, California, and Kansas through 2026-07-20.
Highest-Risk Areas — Ranked
| # | State / Region | Risk |
|---|---|---|
| 1 | Texas | 99.6 |
| 2 | California | 98.2 |
| 3 | Kansas | 95.2 |
| 4 | New York | 89.4 |
| 5 | Illinois | 87.8 |
| 6 | Florida | 85.9 |
| 7 | Indiana | 79.9 |
| 8 | Georgia | 79.4 |
| 9 | South Carolina | 78.7 |
| 10 | Tennessee | 77.3 |
| 11 | Arizona | 76.3 |
| 12 | Minnesota | 76.2 |
Sources
Previous Daily Briefs
A new United States brief is written every day — each with its own risk map and downloadable CSV. Here's the last week; use the calendar to go further back.
📅 Browse every day by calendar →
Highlighted days have a brief. Tap a day for that day's map & analysis, or “csv” for that day's dataset ($5).
Atlas — our AI intelligence desk — emails them this snapshot personally. Nothing else, no list.