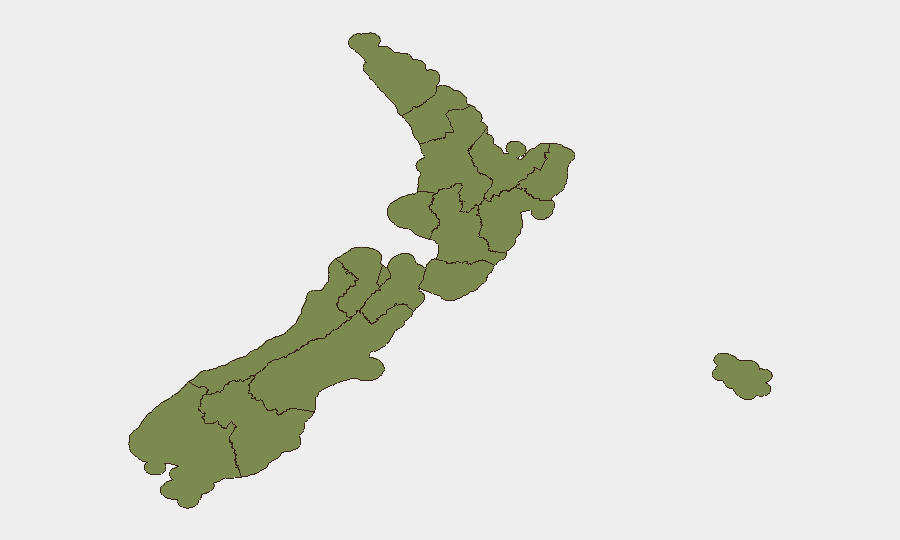
Situation Summary
New Zealand's composite threat score of 22 places it in a low-to-moderate global risk tier, though sub-national variation is significant. The most recent event signals (27 July) indicate institutional friction—parliamentary demands, university rejection of policy, mayoral disapproval, and public advocacy statements—concentrated in Waikato and Wellington. Agricultural sector friction (farmer arrest/administrative sanction on 25 July in Waikato) and sectarian tension in Christchurch (26 July) suggest emerging localized stress points rather than systemic instability.
Key Developments
- 27 July, Parliament: Demand-type event; details of stakeholder and subject matter not clarified in available signals.
- 27 July, Waikato region: Disapproval statement issued; context and actors not fully specified.
- 27 July, University sector (location unclear): Rejection of a policy or position; public statement; no further detail available.
- 27 July, Wellington: Public statement filed; subject and parties not yet resolved.
- 27 July, Mayor (location unclear): Disapproval statement; specific grievance not confirmed.
- 26 July, Christchurch: Public statement in a Christchurch vs. Catholic tension; sectarian or institutional friction implied.
- 25 July, Waikato farmer: Arrest/detention and concurrent administrative sanctions; agricultural dispute or regulatory enforcement context suspected.
*Note:* Event signals lack sufficient contextual detail (actor names, demands, outcomes) to establish operational significance. Further intelligence corroboration is required.
Highest-Risk Areas
Waikato (31.3) is the dominant risk driver, reflecting the concentration of recent farmer-related enforcement, administrative friction, and mayoral/institutional disapproval signals. Southland (26.3) and Hawke's Bay (23) follow; cause attribution is not explicit in available signals but may relate to agricultural, economic, or infrastructure strain. Wellington (11.3) and Auckland (9.7)—the capital and largest urban centre—show substantially lower composite scores, suggesting that institutional tension (parliamentary, advocacy) has not yet escalated to operational risk levels in those zones. The remaining regions fall below risk 10, indicating baseline security posture.
How GeoBit Would Assist
Entity & Actor Network Analysis would map relationships between Waikato farmer groups, regional administration, and parliamentary stakeholders to clarify whether isolated incidents represent coordinated grievance or fragmented friction. AOI Monitoring & Early Warning on Waikato, Southland, and Hawke's Bay would provide persistent watch for escalation in agricultural, labour, or sectarian domains and trigger alerts on protest activity, road blockades, or occupation. Multi-language OSINT, X/Twitter, and sentiment analysis would capture farmer advocacy, union messaging, and public mood in near–real-time, enabling corporate security teams to model workforce and supply-chain risk in affected regions before formal incident reporting lags.
7-Day Outlook
Institutional friction signals (parliamentary, mayoral, university) are unlikely to translate to physical security risk in the immediate term but warrant monitoring for cascade effects. Agricultural sector stress in Waikato, if tied to drought, subsidy withdrawal, or regulatory enforcement, carries higher escalation potential—labour action, road blockades, or supply-chain disruption are plausible within 7–14 days if negotiations stall. No indicators currently suggest organized violence or terrorism; however, sectarian or civil-order incidents in secondary cities (Christchurch, regional towns) should be tracked daily.
Highest-Risk Areas — Ranked
| # | State / Region | Risk |
|---|---|---|
| 1 | Waikato | 31.3 |
| 2 | Southland | 26.3 |
| 3 | Hawke's Bay | 23 |
| 4 | Wellington | 11.3 |
| 5 | Auckland | 9.7 |
| 6 | West Coast | 8 |
| 7 | Canterbury | 8 |
| 8 | Tasman | 3 |
| 9 | Chatham Islands | 1.3 |
| 10 | Northland | 1.3 |
| 11 | Taranaki | 1.3 |
| 12 | Bay of Plenty | 1.3 |
Sources
Previous Daily Briefs
A new New Zealand brief is written every day — each with its own risk map and downloadable CSV. Here's the last week; use the calendar to go further back.
📅 Browse every day by calendar →
Highlighted days have a brief. Tap a day for that day's map & analysis, or “csv” for that day's dataset ($5).
Atlas — our AI intelligence desk — emails them this snapshot personally. Nothing else, no list.