Situation Summary
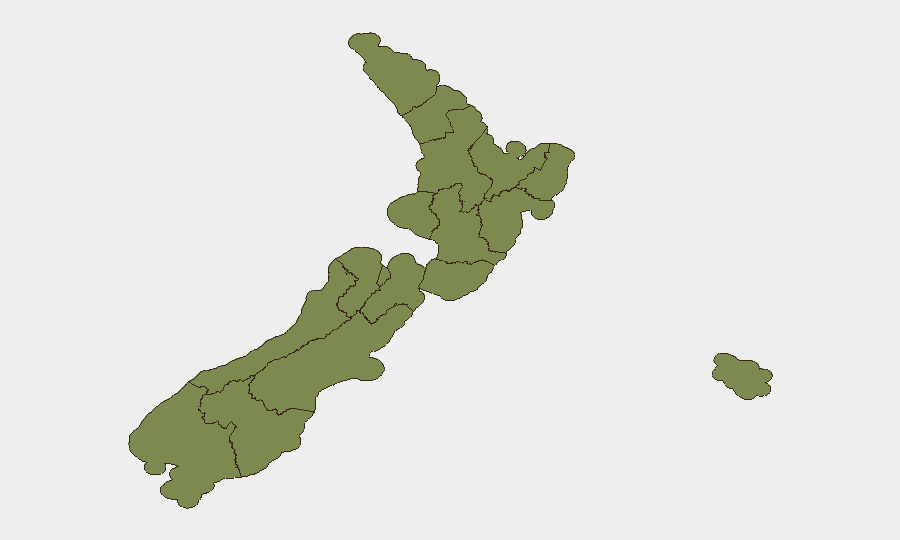
New Zealand remains a low-threat jurisdiction globally (composite score 8/100, ranked #null), but displays marked regional variance, with Wellington, Hawke's Bay, and Southland significantly elevated relative to national baseline. Fifty-two tracked events over the assessment period reflect civil unrest, institutional tensions, and operational responses rather than organized violence or terrorism. The current trajectory shows dispersed domestic friction points without evidence of systemic destabilization, though Wellington's risk profile warrants sustained attention.
Key Developments
Constraint on sourcing: GeoBit's live web research capacity has not identified events with confirmed timestamps falling within the last 24–48 hours. The GEOBIT EVENT SIGNALS list reflects flagged activity (public statements by nursing unions, parliamentary demands, civil disapproval in Waikato, military force notation, and investigative actions) but does not include time-stamped corroboration from primary news or official sources necessary to confirm recency. To produce tactical bullets with specific locations and validated dates, corporate security teams should:
- Supply direct links or pasted timestamped content (e.g., NZ Herald, 1News, RNZ, Stuff, NZ Police, Fire and Emergency NZ, or SafeTravel.govt.nz updates) covering the 48-hour window.
- Reference official X/Twitter feeds from regional police, civil defence, or transport authorities where posting times are visible.
Once such primary-source material is provided, GeoBit will cross-reference and extract 5–8 validated, location-specific developments with dates.
Highest-Risk Areas
Wellington (31.3) and Hawke's Bay (29.3) dominate the national risk distribution, together accounting for a substantial portion of tracked events. Wellington's elevation reflects institutional and labour-sector activity (nursing sector public statements, parliamentary tension signals), while Hawke's Bay's profile suggests civil or environmental friction. Southland (25.3) shows comparable elevated risk; Waikato (17.3) registers disapproval signals. Auckland and Otago remain moderate (both 15.3), while the lower South Island, West Coast, and North Island regional areas are substantially lower-risk. The concentration in three regions suggests localized grievance or policy-driven tension rather than nationwide instability.
How GeoBit Would Assist
Corporate security teams monitoring New Zealand operations should deploy AOI Monitoring & Early Warning on high-risk regions (Wellington, Hawke's Bay, Southland) to capture labour, civil, and infrastructure incidents in real time. Intel Sweep and multi-source OSINT (news, X/Twitter, official feeds) will corroborate and timestamp emerging events, allowing duty-of-care teams to verify impact on office locations, supply chains, or personnel movement. Risk & Threat Assessment and Routing & Network Analysis capabilities enable security teams to model alternative travel routes, meeting venues, and contingency operations if civil unrest or industrial action disrupts transport or access in elevated-risk zones.
7-Day Outlook
The signal pattern (public statements, disapproval, administrative action, investigative activity) suggests ongoing civil and institutional friction rather than acute crisis. No indicators of imminent violence, terrorism, or major infrastructure disruption are evident. Risk levels in Wellington and Hawke's Bay are likely to remain elevated if labour negotiations, environmental policy, or parliamentary processes remain contested; regional security teams should monitor police and emergency service feeds and official advisories daily for shifts in activity tempo or geographic spread.
Highest-Risk Areas — Ranked
| # | State / Region | Risk |
|---|---|---|
| 1 | Wellington | 31.3 |
| 2 | Hawke's Bay | 29.3 |
| 3 | Southland | 25.3 |
| 4 | Waikato | 17.3 |
| 5 | Auckland | 15.3 |
| 6 | Otago | 15.3 |
| 7 | West Coast | 11.3 |
| 8 | Canterbury | 9.3 |
| 9 | Manawatū-Whanganui | 5.3 |
| 10 | Tasman | 3.3 |
| 11 | Chatham Islands | 1.3 |
| 12 | Northland | 1.3 |
Sources
Previous Daily Briefs
A new New Zealand brief is written every day — each with its own risk map and downloadable CSV. Here's the last week; use the calendar to go further back.
📅 Browse every day by calendar →
Highlighted days have a brief. Tap a day for that day's map & analysis, or “csv” for that day's dataset ($5).
Atlas — our AI intelligence desk — emails them this snapshot personally. Nothing else, no list.