Situation Summary
Uruguay maintains a low absolute security threat profile globally (composite score 5, ranked #null) with no verified acute incidents in the last 24–48 hours. However, structural crime trends—particularly a 6.6% year-on-year rise in homicides in the first half of 2026—indicate sustained baseline risk concentration in urban centers, especially Montevideo and Canelones. The government has responded with military asset deployment and reinforced police operations, but no emergency declarations or travel restrictions are in effect. The security environment remains stable relative to regional peers, though organized-crime violence and property crime warrant continued monitoring in high-risk departments.
Key Developments
No verified acute security incidents in Uruguay within the last 24–48 hours. Current open-source monitoring and cross-checked news sources confirm absence of civil unrest, infrastructure disruption, organized-crime violence spikes, or terrorism-related activity in the specified timeframe. Routine crime and structural risk patterns continue without new discrete events meeting temporal and corroboration criteria.
*For baseline context (not current-window developments):*
- Montevideo, mid-July 2026: Government authorized deployment of 12 Mamba MK-7 armored vehicles from the National Army to support police operations in high-crime neighborhoods as part of organized-crime suppression efforts.
- Uruguay nationwide, January–June 2026: Interior Ministry data showed homicides up 6.6% year-on-year; robberies and vehicle thefts declined. Officials characterized the homicide trend as a "yellow light" despite overall low national threat levels.
- Uruguay nationwide, first half of 2026: Traffic-accident fatalities decreased 12.5%, improving one segment of public-safety metrics.
Highest-Risk Areas
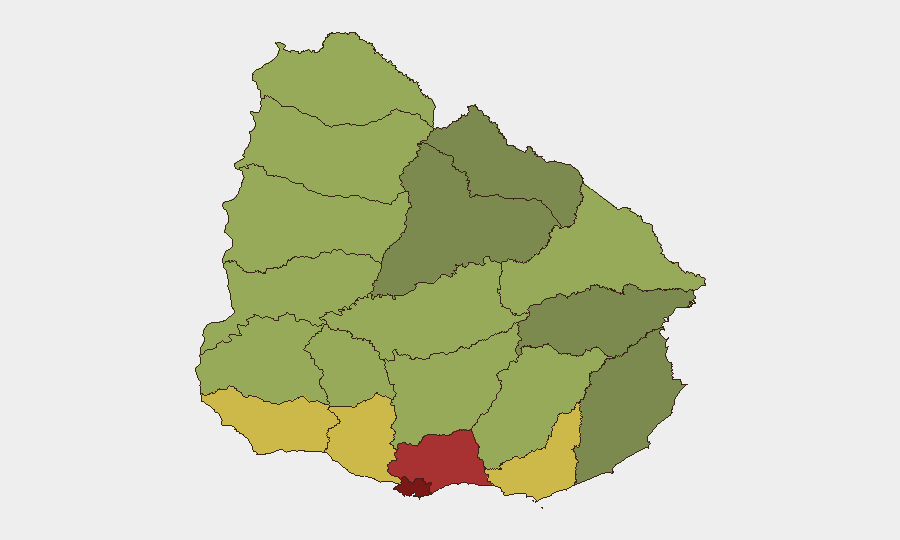
Montevideo (risk 92) and Canelones (risk 78) drive national risk concentration, reflecting organized-crime activity, property crime, and homicide clustering in the capital metropolitan region. Maldonado (68), San José (64), and Colonia (62) follow, suggesting secondary urban and border-adjacent vulnerability zones. The risk gradient reflects population density, transshipment corridors, and gang-territorial dynamics rather than mass civil unrest or political instability. Northern departments (Artigas, Paysandú, Salto) show lower scores but warrant monitoring for cross-border criminal activity and contraband trafficking.
How GeoBit Would Assist
Intelligence & OSINT (multi-language web research, entity extraction, Telegram/social-media monitoring) and AOI Monitoring & Early Warning (persistent watch on Montevideo, Canelones, and northern border zones with threshold alerting) enable security teams to detect organized-crime activity escalation, gang violence clusters, and policy changes in real time. Risk & Threat Assessment and Network & Actor Analysis capabilities support mapping of criminal groups, supply-chain vulnerabilities, and personnel-safety hotspots, while Routing & Network Analysis assists duty-of-care teams in planning alternative travel routes away from high-risk departments during asset or personnel movement.
7-Day Outlook
No acute security events are forecast in the immediate term. However, the persistent homicide-trend increase and ongoing military-police operations in Montevideo suggest sustained operational tempo in organized-crime suppression through at least late July. Corporate teams should maintain routine vigilance in Montevideo and Canelones but need not implement heightened protective postures absent new incident reporting or policy changes.
Report Date: 2026-07-25 | Analyst: GeoBit Senior Analyst | Next Update: 2026-07-26
Highest-Risk Areas — Ranked
| # | State / Region | Risk |
|---|---|---|
| 1 | Montevideo | 92 |
| 2 | Canelones | 78 |
| 3 | Maldonado | 68 |
| 4 | San José | 64 |
| 5 | Colonia | 62 |
| 6 | Soriano | 58 |
| 7 | Río Negro | 56 |
| 8 | Salto | 54 |
| 9 | Artigas | 52 |
| 10 | Paysandú | 50 |
| 11 | Florida | 48 |
| 12 | Flores | 46 |
Sources
Previous Daily Briefs
A new Uruguay brief is written every day — each with its own risk map and downloadable CSV. Here's the last week; use the calendar to go further back.
📅 Browse every day by calendar →
Highlighted days have a brief. Tap a day for that day's map & analysis, or “csv” for that day's dataset ($5).
Atlas — our AI intelligence desk — emails them this snapshot personally. Nothing else, no list.