Situation Summary
New Zealand remains a low–threat environment (global rank #153, composite threat score 3) with no indicators of nationwide instability or civil unrest as of 2 August 2026. Security incidents over the past 48 hours are localized and routine: traffic fatalities, property crime, youth-involved robbery, and infrastructure damage from weather. Law-enforcement intensity is elevated through Operation Foil (200+ arrests, 144 weapons seized), reflecting proactive organized-crime and firearms enforcement rather than emergent instability.
Key Developments
- Port Albert, north Auckland (1 Aug): Single-vehicle fatal crash at 17:25; one fatality, standard emergency-services response.
- Christchurch, Johns Road (1 Aug, ~16:15): Two-vehicle crash with serious injuries; road closed for investigation and repairs.
- West Coast region, Cribb Creek Bridge (1 Aug): Bridge rendered unsafe by creek overflow; road closed pending infrastructure repair, no timeline specified.
- Auckland City West (1 Aug): Two teenagers (15, 17) charged with aggravated robbery; incident isolated, no broader unrest reported.
- Kerikeri, Northland (1 Aug): 37-year-old charged with burglary, theft, and bail breach; court appearance scheduled Kaikohe District Court—routine property-crime enforcement.
- National cyber sector (reported 1 Aug): Canvas LMS data breach affecting New Zealand tertiary institutions; National Cyber Security Centre engaged, privacy and credential-compromise risk to students and academic staff.
- Waikato Hospital ED (1 Aug): Unexpected death in emergency department; health-authority review underway, local concern noted, no criminality indicated.
- National / organized crime (ongoing, reported 1 Aug): Operation Foil enforcement surge: ~200 charged, 144 weapons seized across multiple regions; signals intensified law enforcement, not new instability.
Highest-Risk Areas
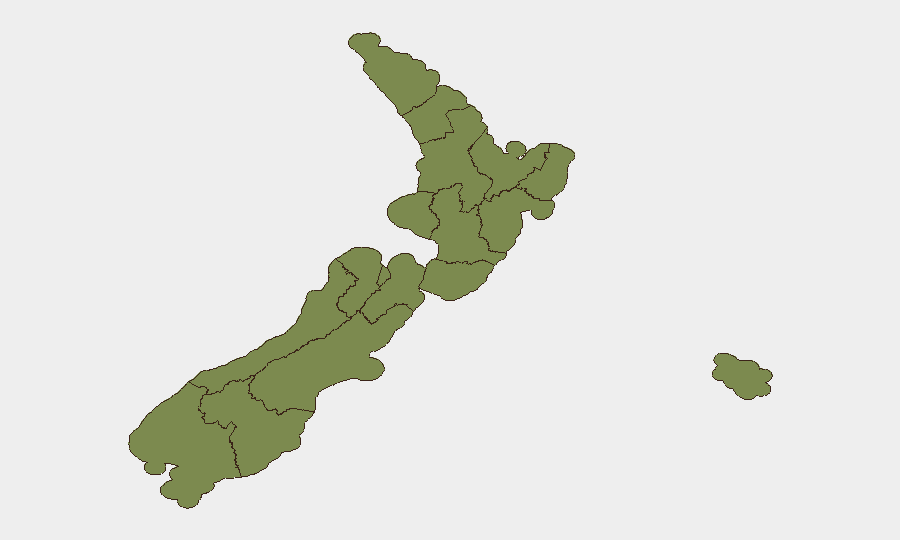
Wellington dominates the sub-national threat profile (risk score 31.4), substantially exceeding all other regions and driving national rank. Manawatū-Whanganui and West Coast follow distantly (risk 10 each), with all other regions scoring below 5. Wellington's elevated score reflects the concentration of political institutions, protest activity, and police-engagement signals recorded in the event database (investigation and disapproval events flagged 31 Jul–1 Aug). West Coast and Manawatū-Whanganui risk appears tied to infrastructure vulnerability and localized enforcement activity. Auckland, despite largest population, scores low (2.1), indicating distributed rather than concentrated threat activity.
How GeoBit Would Assist
Corporate teams with people or assets in New Zealand should employ AOI Monitoring & Early Warning on Wellington and secondary risk regions to detect escalation in political protest or labor unrest before operational impact. Intel Sweep and multi-source OSINT (X/Twitter, Telegram, media feeds) will surface sentiment shifts, union action, or student mobilization faster than traditional news cycles. Cyber risk monitoring via the National Cyber Security Centre feeds and sector-specific breach intelligence will track tertiary and critical-infrastructure vulnerabilities (Canvas exposure is current example) to inform credential-reset and access-control protocols.
7-Day Outlook
No drivers for major security deterioration are visible in the 7-day horizon. Localized crime and infrastructure incidents will likely continue at baseline rates; Operation Foil enforcement activity may yield additional arrests and asset seizures without signaling instability. Wellington warrant close monitoring for political or industrial escalation, but current event signals do not indicate imminent large-scale disruption. Cyber-hygiene upgrades for organizations using Canvas or dependent on tertiary-sector services remain prudent.
Highest-Risk Areas — Ranked
| # | State / Region | Risk |
|---|---|---|
| 1 | Wellington | 31.4 |
| 2 | Manawatū-Whanganui | 10 |
| 3 | West Coast | 10 |
| 4 | Southland | 4.3 |
| 5 | Taranaki | 2.8 |
| 6 | Waikato | 2.8 |
| 7 | Bay of Plenty | 2.8 |
| 8 | Otago | 2.8 |
| 9 | Auckland | 2.1 |
| 10 | Marlborough | 2.1 |
| 11 | Chatham Islands | 1.4 |
| 12 | Northland | 1.4 |
Sources
Previous Daily Briefs
A new New Zealand brief is written every day — each with its own risk map and downloadable CSV. Here's the last week; use the calendar to go further back.
📅 Browse every day by calendar →
Highlighted days have a brief. Tap a day for that day's map & analysis, or “csv” for that day's dataset ($5).
Atlas — our AI intelligence desk — emails them this snapshot personally. Nothing else, no list.