Situation Summary
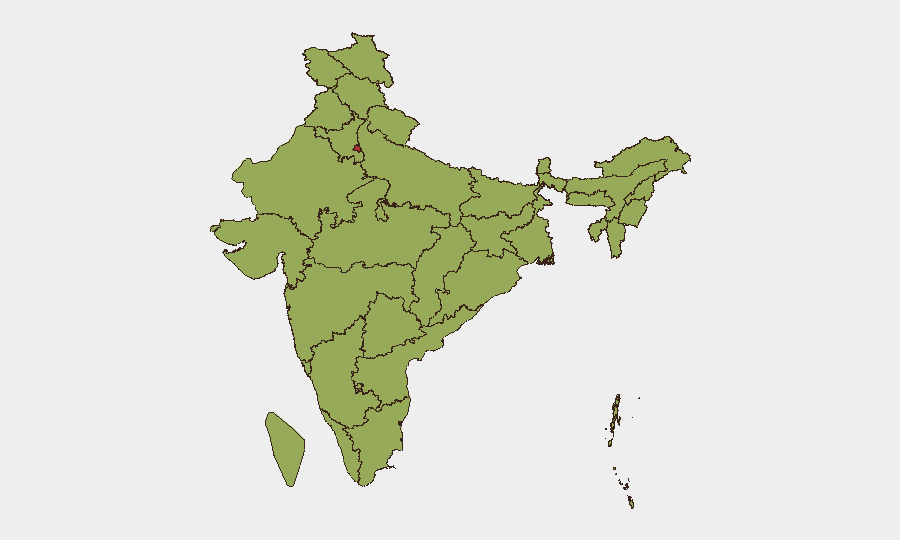
India remains at composite threat level 69 (rank #18 globally), with 418 tracked events as of 2 August 2026. The threat landscape is characterized by elevated civil unrest, military posturing in South Asia, institutional friction, and localized infrastructure incidents. Delhi significantly outpaces other regions in recorded risk (78.6), driven by concentration of political, financial, and population density factors. The overall trajectory reflects structural instability rather than acute escalation, though regional hotspots warrant continuous monitoring.
Key Developments
Data Limitation Notice: Live web research for 1–2 August 2026 has returned no clearly time-stamped, multi-sourced incidents specific to this 24–48-hour window. The most recent confirmed India security events in accessible sources are dated 27–28 July 2026 (outside the requested window). GeoBit event signals for 31 July–1 August reference military, political, banking, prosecutorial, and protest activity, but lack geographic specificity and corroborating detail necessary for actionable reporting.
Reported signal categories (31 July–1 August) include:
- South Asia conventional military force activity (31 July) — *location and parties unconfirmed*
- Presidential and government public statements (31 July) — *subject and context require clarification*
- Banking rejection and protest-related demand/rejection events (31 July–1 August) — *specific entities and locations pending verification*
- Prosecutor and scientist public statements (1 August) — *subject matter unconfirmed*
Recommendation: GeoBit's Intel Sweep and X/Twitter OSINT capabilities should be re-queried for real-time signal validation and geographic/temporal attribution before tactical briefing.
Highest-Risk Areas
Delhi dominates the risk landscape at 78.6, a significant margin above Bihar (57.4) and Maharashtra (55). This gap reflects the capital's role as the nexus of political decision-making, financial systems, diplomatic presence, and 30+ million residents—concentrating exposure to protest, institutional conflict, and cyber-targeting. Bihar and Maharashtra follow due to patterns of communal tensions, organized crime, and labor unrest in industrial/agricultural zones.
The next tier—Odisha, Gujarat, Rajasthan, Uttar Pradesh, and Madhya Pradesh (50.6–54.3)—reflects active civil unrest, border friction (Gujarat/Rajasthan), and historical communal flashpoints. Jammu and Kashmir (50.1) remains elevated due to persistent militant activity and state control measures. For duty-of-care teams, presence in Delhi, Bihar, or Maharashtra warrants the highest preparedness level; routine monitoring is sufficient for southern and eastern states below 50.
How GeoBit Would Assist
AOI Monitoring & Early Warning should establish persistent watches on Delhi, Bihar, and Maharashtra with automated alerting for protest escalation, security force mobilization, or critical infrastructure disruption. Intel Sweep and multi-language OSINT (X/Twitter, Telegram, local news feeds) provide real-time signal detection on civil unrest and institutional friction before mainstream reporting. Routing & Network Analysis enables security teams to identify safe transit corridors and alternative supply routes if primary infrastructure (rail, road, banking channels) becomes compromised. Conflict & Military tracking and regime-stability assessment offer early warning of broader political or military shifts affecting operations.
7-Day Outlook
No imminent large-scale escalation is indicated, though the density of signal activity (military, political, banking, prosecutorial) on 31 July–1 August suggests elevated institutional friction and possible public unrest. Risk will remain elevated in Delhi and northern states through the near term. Corporate teams should expect routine disruption (transport delays, protest-related closures) rather than systemic breakdown, but maintain contingency protocols for rapid personnel movement or supply diversion in high-risk states.
Highest-Risk Areas — Ranked
| # | State / Region | Risk |
|---|---|---|
| 1 | Delhi | 78.6 |
| 2 | Bihar | 57.4 |
| 3 | Maharashtra | 55 |
| 4 | Odisha | 54.3 |
| 5 | Gujarat | 52.8 |
| 6 | Rajasthan | 52.1 |
| 7 | Uttar Pradesh | 50.8 |
| 8 | Madhya Pradesh | 50.6 |
| 9 | Jammu and Kashmir | 50.1 |
| 10 | West Bengal | 50.1 |
| 11 | Tamil Nadu | 49.9 |
| 12 | Jharkhand | 49.7 |
Sources
Previous Daily Briefs
A new India brief is written every day — each with its own risk map and downloadable CSV. Here's the last week; use the calendar to go further back.
📅 Browse every day by calendar →
Highlighted days have a brief. Tap a day for that day's map & analysis, or “csv” for that day's dataset ($5).
Atlas — our AI intelligence desk — emails them this snapshot personally. Nothing else, no list.