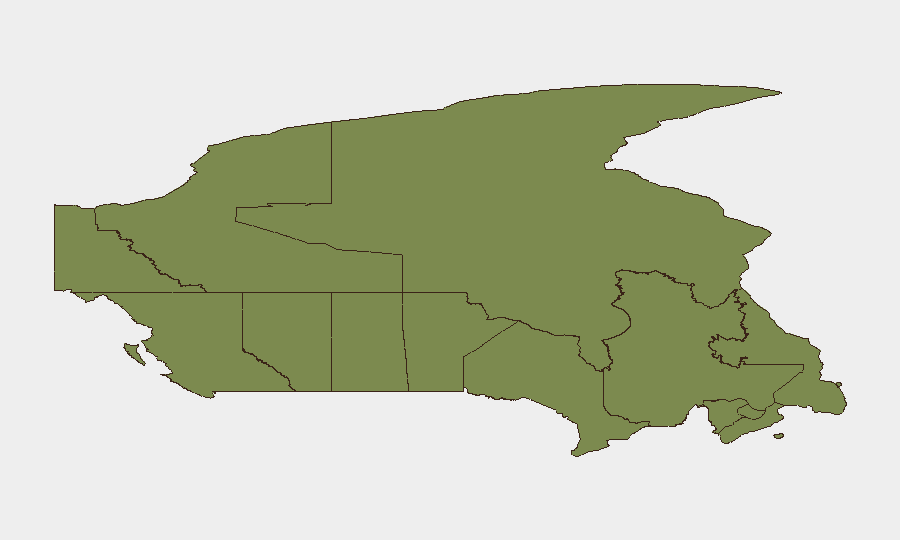
Situation Summary
Canada's composite threat score of 18 places it in the lower-risk quartile globally, though 247 tracked events over the reporting period indicate sustained activity across multiple threat vectors—including conventional military force incidents, investigative actions, and transnational diplomatic tensions. Ontario dominates the sub-national risk profile at 31.3, more than 40% above the next-highest region, reflecting concentrated activity in Canada's largest population and economic center. Recent signals (19–20 July) point to escalating rhetoric, law-enforcement investigative activity, and isolated military-related incidents, particularly in Atlantic Canada. The trajectory suggests moderate but persistent operational tempo rather than imminent systemic disruption.
Key Developments
- Transnational diplomatic escalation (19 July, Canada–Iran). A formal rejection by Canadian authorities of an Iranian position marks the most recent state-level interaction; context and full scope require verification via official Canadian statements and diplomatic channels.
- Aerial weapons incident (19 July, Newfoundland and Labrador). A signal flagged as "Aerial Weapons" activity in Atlantic Canada warrants immediate clarification—confirm whether this involves military exercise, enforcement action, or civilian aviation incident. Specific location and time remain unconfirmed.
- Gang-attributed conventional military force events (19 July, Canada). Two separate signals attributed to gang actors employing military-grade tactics or equipment. Geographic scope and specific incident details require cross-reference with police releases and local intelligence feeds to assess whether this reflects organized-crime escalation or mislabeled reporting.
- Federal investigative activity (19 July, Canadian authorities). A broad investigative signal; likely routine but requires confirmation of subject matter, geography, and agency.
- Ontario-resident threat signal (19 July, Ontario vs. Residents). A localized threat dynamic flagged in the highest-risk sub-national region; specifics unavailable pending additional source verification.
- Voter-related public statement (20 July, Canada). A public statement by voter actors; likely related to ongoing electoral or civic discourse rather than acute security risk, but warrants monitoring if tied to potential civil unrest or institutional pressure.
- Federal military deployment or posture (20 July, Canada). A signal of Canadian conventional military force activity; context unclear (domestic exercise, international commitment, or contingency deployment).
Highest-Risk Areas
Ontario's risk score of 31.3 reflects the concentration of national political institutions, major financial centers, and largest population, creating a broad attack surface for crime, protest, and transnational activity. Nunavut (21.8) and British Columbia (15.7) carry elevated scores likely tied to Arctic geopolitics, resource extraction disputes, and cross-border criminal networks. Quebec (15.2) remains a secondary concern, while Alberta (10) and the Atlantic provinces show moderate baseline risk. Organizations with personnel or assets in the Greater Toronto Area and southern Ontario should prioritize real-time monitoring of local law-enforcement and municipal feeds.
How GeoBit Would Assist
Security teams should activate AOI Monitoring & Early Warning for Ontario's major metros and critical infrastructure; deploy Intel Sweep and X/Twitter OSINT for 24–48-hour incident confirmation and attribution; and use Network & Actor Analysis to map gang and transnational actors. Satellite & Imagery analysis and GIS & Spatial Analysis support rapid damage or tactical assessment if incidents escalate.
7-Day Outlook
Current event density and signal variance suggest ongoing operational activity without indicators of imminent large-scale disruption. Monitoring should remain heightened for confirmation of the aerial weapons and military-force incidents, and for any shift in diplomatic or gang-attributed signals toward coordinated action.
Highest-Risk Areas — Ranked
| # | State / Region | Risk |
|---|---|---|
| 1 | Ontario | 31.3 |
| 2 | Nunavut | 21.8 |
| 3 | British Columbia | 15.7 |
| 4 | Quebec | 15.2 |
| 5 | Alberta | 10 |
| 6 | Northwest Territories | 3.7 |
| 7 | Manitoba | 2.9 |
| 8 | Nova Scotia | 1.9 |
| 9 | Yukon | 1.5 |
| 10 | Saskatchewan | 1.5 |
| 11 | Prince Edward Island | 1.5 |
| 12 | Newfoundland and Labrador | 1.3 |
Previous Daily Briefs
A new Canada brief is written every day — each with its own risk map and downloadable CSV. Here's the last week; use the calendar to go further back.
📅 Browse every day by calendar →
Highlighted days have a brief. Tap a day for that day's map & analysis, or “csv” for that day's dataset ($5).
Atlas — our AI intelligence desk — emails them this snapshot personally. Nothing else, no list.