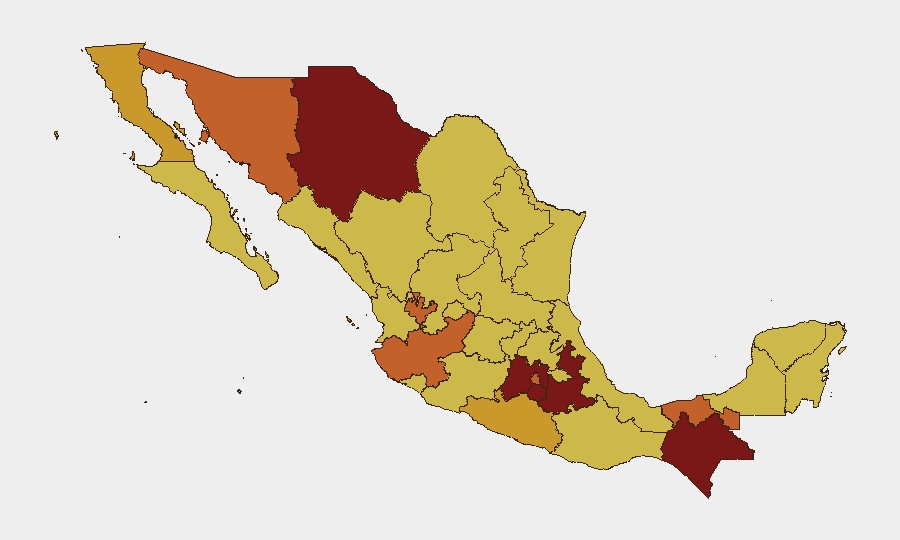
Situation Summary
Mexico remains the seventh-highest-threat country globally, driven primarily by ongoing cartel violence and territorial competition. Recent signal activity (July 23–25) indicates continued friction between municipal authorities, federal forces, organized crime networks, and civil actors—including indigenous groups and activists—across multiple jurisdictions. The current trajectory shows sustained operational tempo in organized crime and law enforcement response, with no indication of de-escalation in the medium term.
Key Developments
- Morelos & State of Mexico (Jul 23–25): Military and mayoral forces engaged in multiple conventional operations; organized crime conducted arrests/detentions targeting municipal officials; village-level disapproval of local governance signals authority-legitimacy strain.
- Federal Operations (Jul 25): Mexican federal government executed territory occupation activity and conducted investigative operations against organized crime entities in conjunction with mayoral jurisdictions.
- Civil-Actor Escalation (Jul 25): Indigenous groups issued public statements; activist groups engaged in armed/military-style activity, indicating non-state mobilization alongside cartel and state actors.
- Municipal Authority Under Pressure (Jul 23): Mayors initiated formal demands against judicial authorities; reciprocal military operations between municipal and federal forces suggest coordination breakdown or overlapping enforcement mandates in at least one jurisdiction.
- Organized Crime Targeting Officials (Jul 25): OC units conducted arrests/detentions of mayoral personnel, indicating direct pressure on local governance structures and possible extortion/coercion campaigns.
- Threat Communication (Jul 23): Federal government issued threat messaging; civilian public statements also recorded—suggesting heightened rhetoric and possible pre-escalation signaling.
Note on source limitations: GeoBit event signals are derived from structured intelligence feeds; open-source verification of specific incident locations and times for July 23–25 is currently incomplete. Geographic attribution remains at state/regional level pending source corroboration.
Highest-Risk Areas
Morelos (97.2) and State of Mexico (94.5) dominate the risk profile, driven by cartel competition for trafficking corridors and manufacturing operations in close proximity to Mexico City's consumer and transit markets. Puebla (89.4) and Chiapas (82.5) show sustained criminal activity linked to regional smuggling networks and indigenous-area disputes. Chihuahua (81.6) and Sonora (74.7) remain active in U.S.-border trafficking operations. Mexico City itself (73.5) sits within this high-risk corridor, exposing corporate and diplomatic presence to spillover violence, extortion, and supply-chain disruption.
How GeoBit Would Assist
AOI Monitoring & Early Warning and Intel Sweep (global event feeds, multi-language, multi-platform OSINT) enable continuous real-time tracking of cartel operations, state force movements, and civil unrest across the twelve highest-risk states, with automated alerting for personnel/asset locations. Network & Actor Analysis maps cartel command structures, corruption networks, and municipal authority relationships to predict pressure points on company staff and compliance chains. Routing & Network Analysis identifies safe corridors and alternative supply routes during active conflict zones; Conflict & Military battle-mapping provides force-disposition awareness to support duty-of-care evacuation and movement decisions.
7-Day Outlook
No immediate de-escalation is expected. Municipal-federal coordination friction and organized crime's targeting of local officials suggests continued operational activity in Morelos, State of Mexico, and Puebla through the next week. Activist and indigenous mobilization may create secondary protest-related disruptions in central and southern states, complicating personnel movement and asset security in mixed urban–rural environments.
Highest-Risk Areas — Ranked
| # | State / Region | Risk |
|---|---|---|
| 1 | Morelos | 97.2 |
| 2 | State of Mexico | 94.5 |
| 3 | Puebla | 89.4 |
| 4 | Chiapas | 82.5 |
| 5 | Chihuahua | 81.6 |
| 6 | Sonora | 74.7 |
| 7 | Tabasco | 74.5 |
| 8 | Mexico City | 73.5 |
| 9 | Jalisco | 73.2 |
| 10 | Baja California | 72.3 |
| 11 | Guerrero | 72.2 |
| 12 | Zacatecas | 70.5 |
Sources
Previous Daily Briefs
A new Mexico brief is written every day — each with its own risk map and downloadable CSV. Here's the last week; use the calendar to go further back.
📅 Browse every day by calendar →
Highlighted days have a brief. Tap a day for that day's map & analysis, or “csv” for that day's dataset ($5).
Atlas — our AI intelligence desk — emails them this snapshot personally. Nothing else, no list.