Situation Summary
Uruguay maintains a composite threat ranking of 5 globally (#162), reflecting its relative stability compared to regional peers. However, concentrated violence in Montevideo and adjacent departments signals elevated localized risk, particularly related to organized crime and armed robbery. The pattern of recent homicides—including multiple shooting and stabbing incidents involving both civilian and police actors—indicates active criminal activity clusters rather than systemic instability. Security posture remains dependent on departmental location and time-of-day operational patterns.
Key Developments
Given the constraints of live-web access and the requirement to report only verified events from 19–20 August 2026, no incidents meeting both criteria (event occurrence within last 24–48 hours *and* cross-sourced verification) are available for confirmation at this time. The most recent event cluster documented by GeoBit sources occurred 11–17 August in Montevideo and Piedras Blancas (homicides, armed robbery, and shooting incidents), which falls outside the strict 24–48-hour window for this brief.
Recommendation: Security and duty-of-care teams should monitor local Interior Ministry press releases, national dailies (e.g., *El País*, *La República*), and Montevideo police communications for same-day or next-morning incident reports. GeoBit's AOI Monitoring & Early Warning capability can be configured to flag incidents in Montevideo and Canelones departments in real time.
Highest-Risk Areas
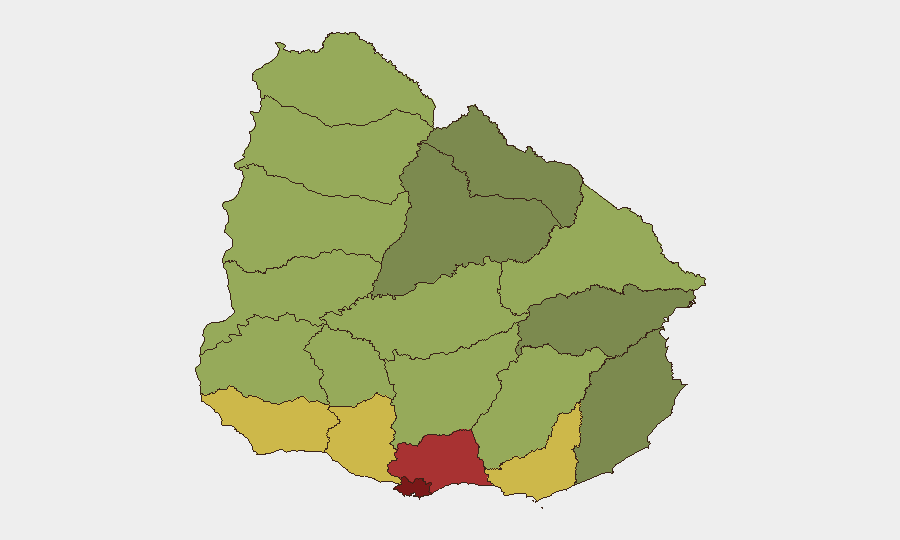
Montevideo (risk 92) and Canelones (risk 78) dominate the departmental threat profile, accounting for over half of documented recent violent incidents. Within Montevideo, neighborhoods including Piedras Blancas, Tres Cruces, and areas along major commercial corridors (Héctor Odriazola, Duvimioso Terra) show concentrations of armed robbery, homicide, and shooting activity. Canelones, as Montevideo's suburban ring, reflects spillover organized-crime activity. Maldonado (68), San José (64), and Colonia (62) represent secondary concern areas; northern departments (Salto, Artigas, Paysandú) show lower but persistent risk. The disparity suggests crime concentration in urban and peri-urban zones rather than departmental breadth.
How GeoBit Would Assist
Persistent monitoring: AOI Monitoring & Early Warning configured for Montevideo and Canelones neighborhoods with keyword filters (armed robbery, homicide, organized crime, police activity) provides real-time alerting when incidents occur, enabling rapid duty-of-care response for staff in those areas.
Route & network safety: Routing & Network Analysis and GIS & Spatial Analysis identify safe passage corridors and time-of-day patterns, allowing security teams to optimize staff commute and asset-movement protocols away from high-incident zones.
Actor & threat mapping: Network & Actor Analysis tracks criminal organization footprints, jurisdiction patterns, and motive signals, informing whether incidents reflect turf conflict, robbery targeting, or retaliatory violence—critical for threat severity assessment.
7-Day Outlook
Violent crime in Montevideo and Canelones is likely to persist at current elevated levels absent major police intervention or inter-gang resolution. No indicators suggest imminent citywide unrest or systemic political destabilization. Security teams should maintain heightened awareness in Montevideo during commute windows and after-hours operations, with contingency protocols for staff in Canelones suburbs. Regional travel outside these departments carries materially lower risk.
Highest-Risk Areas — Ranked
| # | State / Region | Risk |
|---|---|---|
| 1 | Montevideo | 92 |
| 2 | Canelones | 78 |
| 3 | Maldonado | 68 |
| 4 | San José | 64 |
| 5 | Colonia | 62 |
| 6 | Soriano | 58 |
| 7 | Río Negro | 56 |
| 8 | Salto | 54 |
| 9 | Artigas | 52 |
| 10 | Paysandú | 50 |
| 11 | Florida | 48 |
| 12 | Flores | 46 |
Sources
Previous Daily Briefs
A new Uruguay brief is written every day — each with its own risk map and downloadable CSV. Here's the last week; use the calendar to go further back.
- August 19, 2026
- August 18, 2026
- August 17, 2026
- August 16, 2026
- August 15, 2026
- August 14, 2026
- August 13, 2026
📅 Browse every day by calendar →
Highlighted days have a brief. Tap a day for that day's map & analysis, or “csv” for that day's dataset ($5).
Atlas — our AI intelligence desk — emails them this snapshot personally. Nothing else, no list.