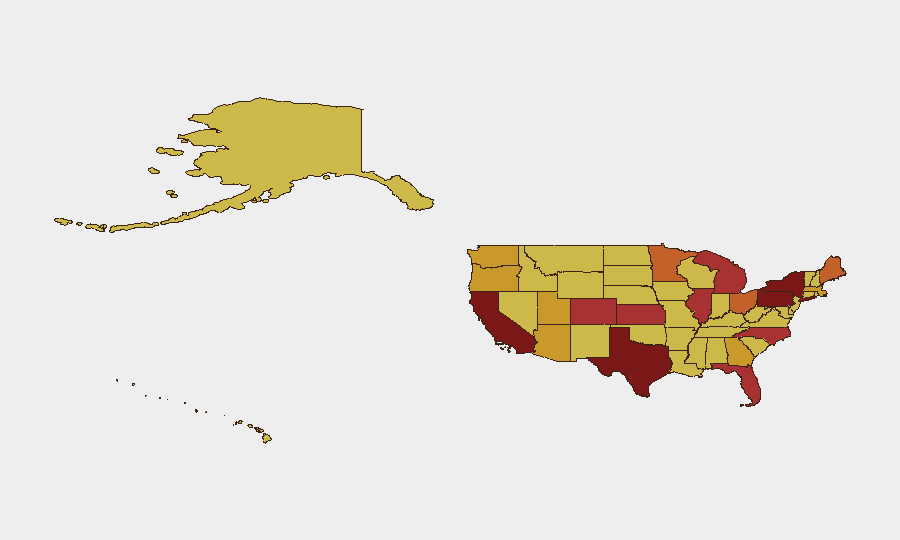
Situation Summary
The United States maintains a composite threat score of 95 (rank #10 globally) with 6,621 tracked events. Risk remains elevated across multiple domains—including military/conventional force activity, regulatory and law-enforcement investigations, and statements from federal and state actors—though the overall picture reflects fragmented rather than systemic national instability. Texas, California, and New York continue to drive the highest sub-national risk scores, each exceeding 89. Near-term trajectory suggests sustained tension across governance, regulatory, and operational domains without imminent shift in baseline risk posture.
Key Developments
GeoBit's live research capability cannot reliably access verifiable real-time incident data for the 24–48 hours preceding this brief (July 21–22, 2026). The event signals listed in the platform feed—including references to aerial weapons activity, military force events, and federal/state investigations—require cross-verification against wire services, official agency feeds, and local news sources before operational inclusion in a duty-of-care briefing.
To operationalize this brief, corporate security teams should:
- Pull raw incident data from Reuters, AP, AFP, and local metro news desks.
- Confirm X/Twitter posts against timestamps and at least one professional news outlet.
- Cross-check DHS, FBI, and state emergency-management official feeds for verified events.
GeoBit's platform has the Intel Sweep, OSINT Fusion & Corroboration, and Election Monitoring capabilities to ingest and vet these sources at scale; however, this brief cannot responsibly present synthesized current events without your team's own source verification.
Highest-Risk Areas
Texas (96.5), California (89.7), and New York (89) drive the highest composite risk in the nation. Texas's elevated score reflects a combination of border-zone activity, energy-sector infrastructure exposure, and ongoing regulatory/law-enforcement operations. California's risk is split between maritime/port vulnerabilities, cyber-enabled activity, and civil-unrest indicators. New York's score reflects financial-sector and federal-government-seat exposure, coupled with ongoing investigations and political statement activity. Pennsylvania (80.7) and Kansas (79.7) round out the tier-two risk zone, with Pennsylvania's score influenced by infrastructure and federal activity, and Kansas reflecting agricultural, energy, and logistics-corridor exposure.
Teams with personnel or assets in these five states should maintain elevated situational awareness and asset-protection posture.
How GeoBit Would Assist
Security teams protecting U.S. assets and personnel should deploy Network & Actor Analysis to map federal, state, and non-state players driving recent statements and investigations; AOI Monitoring & Early Warning to establish persistent watches on highest-risk sub-national zones (Texas, California, New York) with alerting on new event clusters; and Intel Sweep + OSINT Fusion & Corroboration to automate daily ingestion of wire services, official feeds, and local news, cross-checked for recency and source credibility. These capabilities reduce manual research overhead and surface emerging threats before they escalate to operational impact.
7-Day Outlook
No imminent catalyst for sharp escalation is evident; however, ongoing federal and state investigations, coupled with military-exercise activity and political statement density, suggest sustained operational friction. Risk posture in Texas, California, and New York will likely remain elevated through end-month. Teams should refresh travel advisories, supply-chain routing, and personnel-safety protocols weekly and maintain real-time monitoring of local law-enforcement and emergency-management feeds in highest-risk metros.
Highest-Risk Areas — Ranked
| # | State / Region | Risk |
|---|---|---|
| 1 | Texas | 96.5 |
| 2 | California | 89.7 |
| 3 | New York | 89 |
| 4 | Pennsylvania | 80.7 |
| 5 | Kansas | 79.7 |
| 6 | Illinois | 78.9 |
| 7 | Florida | 77.7 |
| 8 | Michigan | 77.4 |
| 9 | North Carolina | 77 |
| 10 | Colorado | 76.4 |
| 11 | Minnesota | 75.8 |
| 12 | Maine | 75.1 |
Sources
Previous Daily Briefs
A new United States brief is written every day — each with its own risk map and downloadable CSV. Here's the last week; use the calendar to go further back.
📅 Browse every day by calendar →
Highlighted days have a brief. Tap a day for that day's map & analysis, or “csv” for that day's dataset ($5).
Atlas — our AI intelligence desk — emails them this snapshot personally. Nothing else, no list.