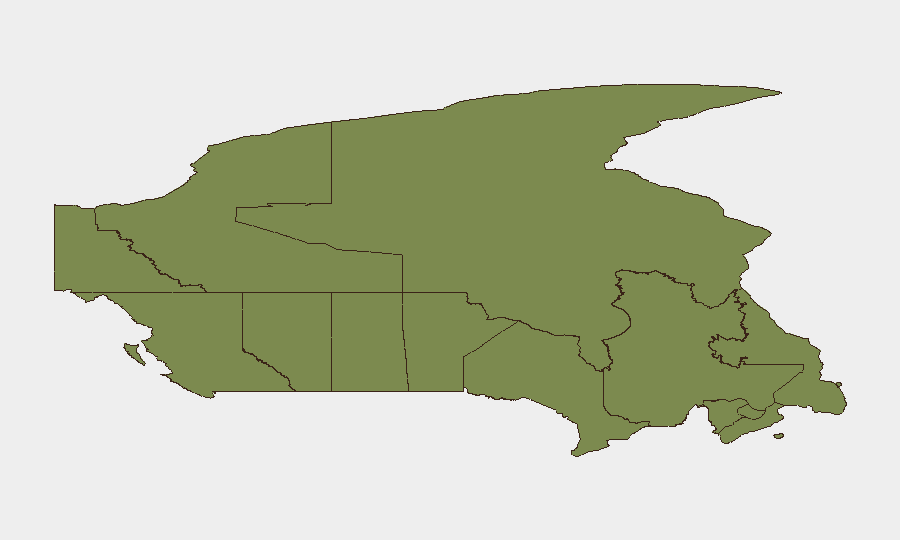
Situation Summary
Canada remains a relatively low-threat environment globally (rank #81, composite score 2), but sub-national disparities are pronounced. Ontario, Quebec, and British Columbia collectively account for the majority of tracked security events, with Ontario's risk score (31.4) substantially exceeding other provinces. Recent signal activity (23 July) indicates elevated law-enforcement engagement, prison incidents, and business-sector threats concentrated in Ontario and Montreal, suggesting localized volatility rather than systemic national instability.
Key Developments
- 23 July · Ontario Prison Incident – Arrest/detain event at Ontario correctional facility; concurrent small-arms combat signal on 22 July suggests potential custody-related violence or disturbance requiring active monitoring.
- 23 July · Montreal Police Activity – Multiple arrest/detain signals linked to Montreal police operations; 22 July police-vs-Montreal event indicates ongoing enforcement action in the Quebec metropolitan area.
- 23 July · Business Threat Signal – Unspecified threat-to-companies event flagged in national signals; no geographic specificity provided; requires urgent clarification on sector and location.
- 22 July · Toronto Public Statement – Toronto-based business sector statement registered as a potential disapproval or protest action; context and scale remain unclear pending corroboration.
- 23 July · Territory Occupation & Rejection – Canada-level "occupy territory" and "reject" signals detected; insufficient corroboration to confirm scale, location, or legitimacy; may indicate protest, Indigenous land action, or operational misclassification.
- 22 July · National Police Investigation – Canada-level investigate-vs-police signal suggests federal or provincial scrutiny of law-enforcement conduct; timing and scope unconfirmed.
Data Caveat: GeoBit's live web research identified meta-level economic announcements and routine border enforcement activity (CBSA food/animal product interdiction at Toronto Pearson) but insufficient corroborated incident detail to include as discrete developments. Additional source corroboration recommended before operational decisions.
Highest-Risk Areas
Ontario and Quebec dominate the national risk profile, with Ontario's score (31.4) nearly 4× the national average and 13× Alberta's (7.5). Both provinces' elevated risk reflects population density, law-enforcement activity concentration, and protest/activism signal frequency. British Columbia (25.2) ranks third, driven primarily by Vancouver and lower-mainland metropolitan activity. All other provinces fall below risk score 8, indicating that Canada's security events are geographically clustered in urban centers along the southern border and major metropolitan corridors. Corporate and government operations in Toronto, Montreal, and Vancouver should expect higher event frequency and faster-moving incidents.
How GeoBit Would Assist
Security teams protecting Canadian assets should deploy Intel Sweep and AOI Monitoring & Early Warning on Ontario and Quebec metropolitan areas to track emerging protest, enforcement, and labor activity in real time. OSINT Fusion & Corroboration (X/Twitter, Telegram, news feeds, and YouTube) would rapidly disambiguate the 23 July business threat and territory-occupation signals before they escalate. Network & Actor Analysis would map protest organizers and enforcement patterns to anticipate flashpoints in Toronto and Montreal, while Routing & Network Analysis would enable alternative journey planning for personnel or supply chains affected by emerging blockades or occupations.
7-Day Outlook
Signals suggest localized law-enforcement pressure and protest-sector activity in Ontario and Quebec will remain elevated through late July. Small-arms and custody-related incidents in Ontario require close monitoring for copycat or escalation; no indication of mass mobilization or national coordination yet. If the 23 July "occupy territory" and "reject" signals represent coordinated protest or Indigenous actions, mid-week (24–25 July) flashpoints in Toronto or Montreal are possible.
Highest-Risk Areas — Ranked
| # | State / Region | Risk |
|---|---|---|
| 1 | Ontario | 31.4 |
| 2 | Quebec | 25.3 |
| 3 | British Columbia | 25.2 |
| 4 | Alberta | 7.5 |
| 5 | Manitoba | 6.6 |
| 6 | Saskatchewan | 3.4 |
| 7 | Newfoundland and Labrador | 2 |
| 8 | Northwest Territories | 1.9 |
| 9 | Nova Scotia | 1.9 |
| 10 | Nunavut | 1.7 |
| 11 | Yukon | 1.5 |
| 12 | Prince Edward Island | 1.5 |
Sources
Previous Daily Briefs
A new Canada brief is written every day — each with its own risk map and downloadable CSV. Here's the last week; use the calendar to go further back.
📅 Browse every day by calendar →
Highlighted days have a brief. Tap a day for that day's map & analysis, or “csv” for that day's dataset ($5).
Atlas — our AI intelligence desk — emails them this snapshot personally. Nothing else, no list.