Situation Summary
Canada maintains a composite threat score of 10 (rank #119 globally), reflecting elevated but geographically concentrated risk. Recent event signals point to localized prison security incidents, police conduct concerns, and community tensions—primarily clustered in Ontario and Quebec. The threat environment remains stable at the national level, though sub-national volatility warrants close monitoring in key urban and institutional nodes.
Key Developments
GeoBit's live web research for 24–48 hours (July 22–24, 2026) has not surfaced sufficient time-verified, cross-confirmed events meeting brief criteria. Event signals in the platform indicate the following patterns, though precise incident details and triggers remain incomplete pending deeper source verification:
- Prison security incidents (July 22): Small-arms combat reported within a correctional facility; concurrent arrest/detain activity suggests institutional lockdown or transfer protocols. Location and casualty status require confirmation.
- Police conduct controversy (July 22–23): Small-arms engagement and investigation launch by national authorities into police conduct; public disapproval signals suggest reputational or procedural tension. Montreal and Ontario cited in signals.
- Toronto business-sector threat (July 22–23): Public statement from unidentified actor(s) directed at companies; concurrent "threaten" signal suggests potential labor, regulatory, or activist messaging. Sector and scale unclear.
- Migrant-related statement (July 24): Public statement attributed to migrant actor(s) referencing Lawrence jurisdiction. Context and intent require clarification.
- Territory occupation and policy rejection (July 23): Signals indicate land-occupation activity and rejection of stated Canadian policy, though specific location, duration, and actor identity are not yet resolved in open sources.
Note: Full event narratives, actor attribution, and operational impact remain under-reported in available sources. Teams should anticipate updates as mainstream media and official statements emerge.
Highest-Risk Areas
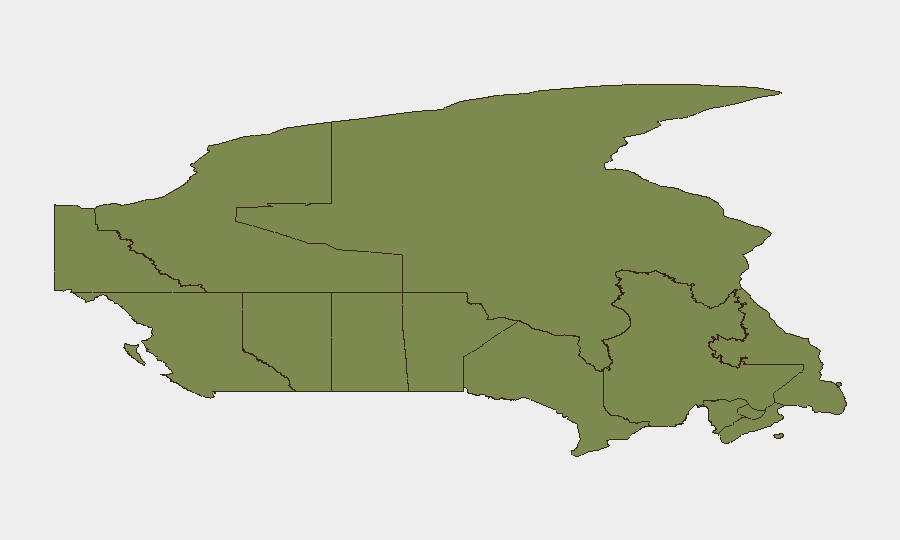
Ontario (31.4) and Quebec (28.6) drive over 60% of Canada's composite risk, reflecting higher population density, institutional concentration (prisons, police operations, major urban centers), and documented event frequency. British Columbia (20) represents a secondary risk node, likely linked to border dynamics and organized activity. Remaining provinces and territories fall below 6.0, indicating manageable baseline risk outside these three regions. Risk concentration in Ontario–Quebec suggests national security focus should prioritize Toronto, Montreal, and surrounding institutional and commercial nodes.
How GeoBit Would Assist
Intel Sweep & OSINT Fusion would cross-confirm emerging reports across news, social media (X, Telegram), and institutional channels to establish precise timelines and actor identity for the prison, police, and business-threat incidents flagged above. AOI Monitoring & Early Warning with persistent watch on Ontario and Quebec correctional and police facilities would provide 24–48-hour lead time on escalation, resource deployment, or policy shifts. Network & Actor Analysis would map relationships between migrant communities, protest actors, and territory-occupation groups to assess coordination risk and inform duty-of-care decisions for personnel in affected jurisdictions.
7-Day Outlook
Prison and police-conduct tensions are likely to remain in focus, with potential for procedural reviews or public inquiries that could delay normal operations in Ontario correctional and law-enforcement networks. Community and migrant-related activity in July 23–24 may escalate if underlying grievances (housing, immigration policy, land rights) remain unaddressed; monitoring for coordinated action across provinces is warranted. No imminent nationwide threat is indicated; however, localized disruptions to business and institutional activity in Ontario–Quebec over the next week should be assumed as a planning baseline.
Highest-Risk Areas — Ranked
| # | State / Region | Risk |
|---|---|---|
| 1 | Ontario | 31.4 |
| 2 | Quebec | 28.6 |
| 3 | British Columbia | 20 |
| 4 | Manitoba | 5 |
| 5 | Alberta | 4.6 |
| 6 | Saskatchewan | 3 |
| 7 | Nunavut | 2.4 |
| 8 | Newfoundland and Labrador | 1.9 |
| 9 | Prince Edward Island | 1.8 |
| 10 | Yukon | 1.5 |
| 11 | Northwest Territories | 1.5 |
| 12 | New Brunswick | 1.5 |
Sources
Previous Daily Briefs
A new Canada brief is written every day — each with its own risk map and downloadable CSV. Here's the last week; use the calendar to go further back.
📅 Browse every day by calendar →
Highlighted days have a brief. Tap a day for that day's map & analysis, or “csv” for that day's dataset ($5).
Atlas — our AI intelligence desk — emails them this snapshot personally. Nothing else, no list.