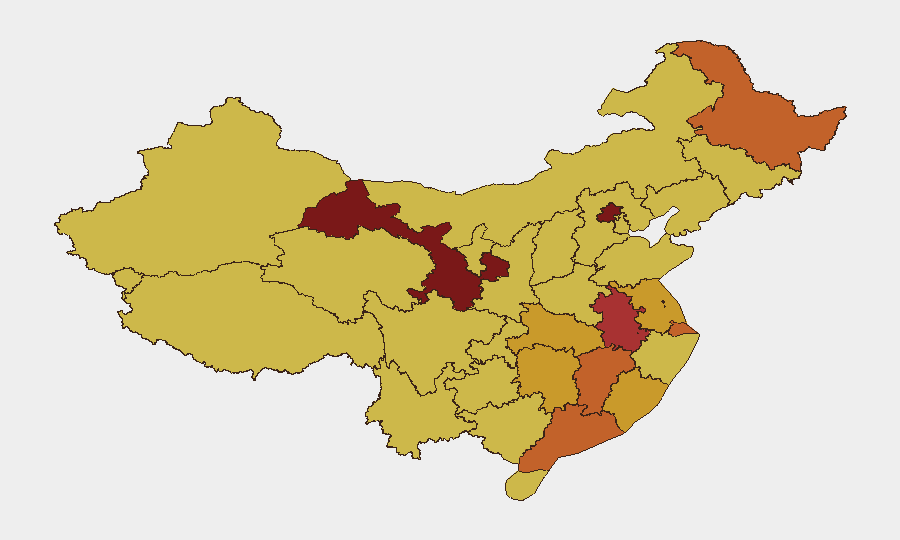
Situation Summary
China's composite threat environment remains elevated (rank #4 globally, 1167 tracked events), driven by escalating U.S.–China diplomatic friction, domestic enforcement actions targeting foreign investors and financial entities, and acute natural-disaster risk in southwestern regions. Recent geopolitical signals—U.S. rejections and disapprovals, Chinese public statements toward banking and intelligence sectors, and unverified manufacturer threats—suggest pressure on foreign business operations and compliance scrutiny. Concurrently, weather-driven infrastructure failures in Chongqing and Yunnan create secondary mobility and supply-chain risks for personnel in those zones.
Key Developments
- Chongqing, southwest China (2026-07-19, Friday): Landslide triggered collapse of multiple residential buildings downhill; Reuters and local aggregators report 8 dead, 10 rescued, and 34 missing. Unknown if rescue operations ongoing; secondary landslide and flooding risk remain elevated in the region.
- Chongqing / Yunnan region (2026-07-18, Sunday): China Meteorological Administration issued heavy rain alert following earlier mountain-flood warnings. Emergency evacuations in vulnerable areas are possible; road and rail access may be disrupted.
- U.S.–China diplomatic escalation (2026-07-18–07-19): Washington issued formal rejection and White House disapproval statements; Chinese authorities issued counter–public statements directed at banking and intelligence sectors. Signals suggest heightened scrutiny of foreign financial and tech operations.
- Foreign investor detention (2026-07-17): Unconfirmed arrest or detention of at least one investor; incident cited in GEOBIT event feed but specific location and charges not yet available.
- Manufacturer threat signal (2026-07-17): Unidentified manufacturer issued threat directed at Chinese counterpart or entity; context and sector unclear from available reporting.
- China–Russia statement (2026-07-19): Public statement issued between Chinese and Russian authorities; content and intent unclear; may signal geopolitical realignment or coordination in response to U.S. actions.
Highest-Risk Areas
Gansu (risk 100) and Beijing (risk 94) lead the sub-national ranking, though the brief does not yet explain Gansu's spike—investigation of political, security, or infrastructure drivers is warranted. Shanghai (75.7), Guangdong (74.3), and Anhui (78.6) remain consistently elevated, reflecting their density of foreign investment, trade hubs, and tech manufacturing. The southwestern cluster—Yunnan, Guizhou, Hunan—combines natural-disaster vulnerability with political sensitivity; personnel in Chongqing and adjacent zones face compounded risk from both environmental and enforcement threats over the next 7–14 days.
How GeoBit Would Assist
Intel Sweep and multi-language OSINT fusion across Reuters, local Mandarin media, and X/Telegram would isolate the investor-detention incident details, manufacturer threat motive, and Gansu risk drivers in near real time. AOI Monitoring & Early Warning configured for Chongqing, Yunnan, and Gansu would alert security teams to ongoing rescue operations, secondary hazards, and permit/checkpoint changes. Network & Actor Analysis would map enforcement actions and banking-sector statements to identify which foreign firms face heightened compliance or exit-ban risk.
7-Day Outlook
Diplomatic friction with the U.S. is likely to sustain or intensify foreign-business scrutiny, particularly in finance, semiconductors, and critical supply chains; exit-ban and asset-freeze risk should be treated as elevated. Southwestern weather systems are forecast to persist; road/rail corridors in Chongqing, Yunnan, and Guizhou may remain disrupted through mid-week, complicating personnel movement and supply logistics. No signals yet indicate imminent large-scale violence or regime instability, but the pace of U.S.–China public statements and Chinese enforcement actions warrants daily monitoring.
Highest-Risk Areas — Ranked
| # | State / Region | Risk |
|---|---|---|
| 1 | Gansu | 100 |
| 2 | Beijing | 94 |
| 3 | Anhui | 78.6 |
| 4 | Shanghai | 75.7 |
| 5 | Guangdong Province | 74.3 |
| 6 | Heilongjiang | 74 |
| 7 | Jiangxi | 73.1 |
| 8 | Hunan | 72.9 |
| 9 | Fujian | 72.7 |
| 10 | Jiangsu | 72.2 |
| 11 | Hubei | 71.8 |
| 12 | Guizhou | 70.9 |
Sources
Previous Daily Briefs
A new China brief is written every day — each with its own risk map and downloadable CSV. Here's the last week; use the calendar to go further back.
📅 Browse every day by calendar →
Highlighted days have a brief. Tap a day for that day's map & analysis, or “csv” for that day's dataset ($5).
Atlas — our AI intelligence desk — emails them this snapshot personally. Nothing else, no list.