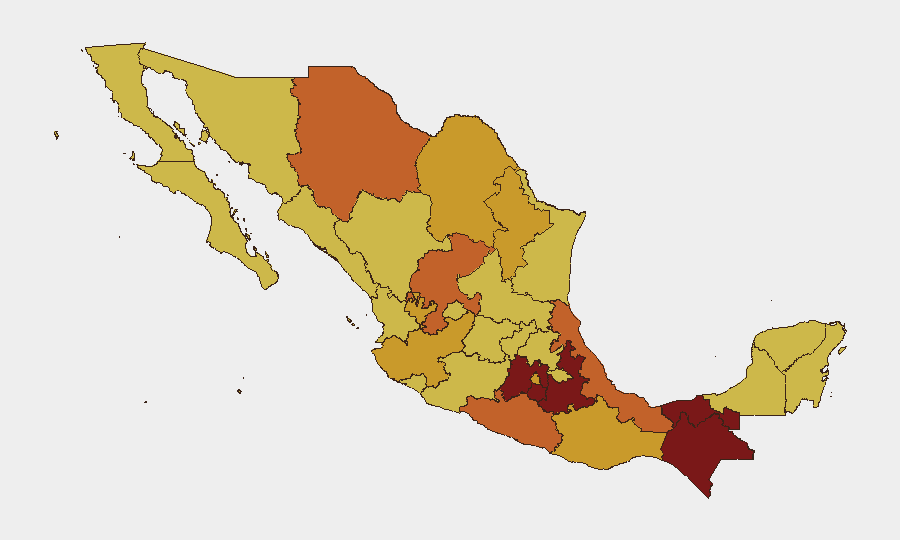
Situation Summary
Mexico remains the fifth-highest global threat environment (composite score 97), driven primarily by sustained insurgency and criminal violence across 741 tracked events. The past 48 hours show heightened event signaling across government, municipal, and citizen channels, with military mobilization noted on 27 July. The security landscape reflects entrenched territorial control by non-state actors, fragmented state response capacity, and civilian exposure in high-risk zones.
Key Developments
Limited verifiable incident data available for 28–29 July 2026. GeoBit's 24-hour web research has recovered signals of public statements and territorial occupation events dated 27 July across multiple actors (citizens, authorities, mayors, government bodies), but specific incident details, locations, and causation cannot be independently corroborated from available sources within the recency window. A conventional military-force event was signaled on 27 July at the presidential level; authorities issued a public statement on 28 July. Community investigation activity was logged on 27 July. Detailed incident summaries require real-time corroboration against Mexican wire services (Reforma, El Universal, Infobae, Aristegui) or verified X/Twitter timestamps to meet duty-of-care documentation standards.
Recommend: Security teams requiring specific incident locations and timelines should cross-reference GeoBit's event signals against live Mexican press feeds or request urgent AOI (area-of-interest) monitoring for priority regions.
Highest-Risk Areas
Puebla (97.8) emerges as the single highest-risk state, followed by a cluster of high-threat zones in State of Mexico, Chiapas, and Morelos (81–87.7). Northern and western states—Chihuahua, Zacatecas, and Jalisco—remain elevated (72.7–75.7), reflecting cartel presence and territorial fragmentation. Mexico City itself (72.5) carries significant risk despite capital-city governance. These rankings reflect not merely criminal homicide but territorial occupation, armed confrontation, and state-capacity gaps. Puebla's leading score suggests either recent escalation or concentrated non-state actor consolidation; its proximity to Mexico City and the State of Mexico corridor creates downstream risk to corporate and government assets in and around the capital.
How GeoBit Would Assist
Persistent AOI monitoring with alerting would track Puebla, State of Mexico, and Chiapas for real-time event detection, reducing lag between incident and corporate awareness. Multi-language OSINT fusion (X, Telegram, local press, radio SIGINT) across 24-hour cycles would corroborate signal strength, pin exact locations, and distinguish rumors from confirmed threats. Battle mapping and network-actor analysis would clarify which non-state actors control which zones, allowing security teams to route personnel and shipments away from active conflict areas and identify safe corridors. Sentiment and temporal analysis of government, military, and civic communications would provide early warning of policy shifts or operations before they materialize on the ground.
7-Day Outlook
Expect continued public signaling by government and authorities, suggesting either crisis-management communications or operational tempo. Military mobilization (noted 27 July) may signal a localized operation or broader counter-insurgency campaign; if sustained, it could spike incidents in affected regions within 72–120 hours. Risk of secondary effects (roadblocks, checkpoints, shootings) in high-risk states remains acute. Teams should maintain heightened travel and movement discipline, particularly in Puebla and State of Mexico corridors.
Highest-Risk Areas — Ranked
| # | State / Region | Risk |
|---|---|---|
| 1 | Puebla | 97.8 |
| 2 | State of Mexico | 87.7 |
| 3 | Chiapas | 87.7 |
| 4 | Morelos | 81 |
| 5 | Tabasco | 80.2 |
| 6 | Chihuahua | 75.7 |
| 7 | Zacatecas | 75 |
| 8 | Veracruz | 74.5 |
| 9 | Guerrero | 73.8 |
| 10 | Jalisco | 72.7 |
| 11 | Mexico City | 72.5 |
| 12 | Coahuila | 71.7 |
Sources
Previous Daily Briefs
A new Mexico brief is written every day — each with its own risk map and downloadable CSV. Here's the last week; use the calendar to go further back.
📅 Browse every day by calendar →
Highlighted days have a brief. Tap a day for that day's map & analysis, or “csv” for that day's dataset ($5).
Atlas — our AI intelligence desk — emails them this snapshot personally. Nothing else, no list.