Situation Summary
Syria remains the 11th-highest-threat country globally (composite score 96) with 119 tracked events as of 20 July 2026. Recent signals indicate sustained military operations, territorial contestation, and law-enforcement detentions concentrated in the northern and central regions. The threat environment reflects fragmented state control, ongoing conventional and unconventional violence, and active detention of activists—a pattern consistent with post-conflict fragility rather than stabilization.
Key Developments
Note: GeoBit's live web research window (last 24–48 hours) did not yield sufficient timestamped, verifiable reporting to isolate 6–10 discrete new events from the background conflict stream. The event signals listed above (all dated 2026-07-18) indicate military operations, territorial occupation, activist detentions, and threats involving aerospace actors, but underlying incident details, locations, and confirmation sources are not sufficiently granular in the provided data. Security teams should cross-reference these signals against primary news feeds and diplomatic reporting to confirm specifics before operational decisions. Broadly, the 18 July signals suggest:
- Military operations involving conventional force and territorial occupation by state and non-state actors.
- Law-enforcement and detention activity targeting activist/opposition figures.
- Unconventional violence incidents in unspecified locations.
- Threats or statements involving aerospace and U.S. actors (likely regional escalation signals).
Highest-Risk Areas
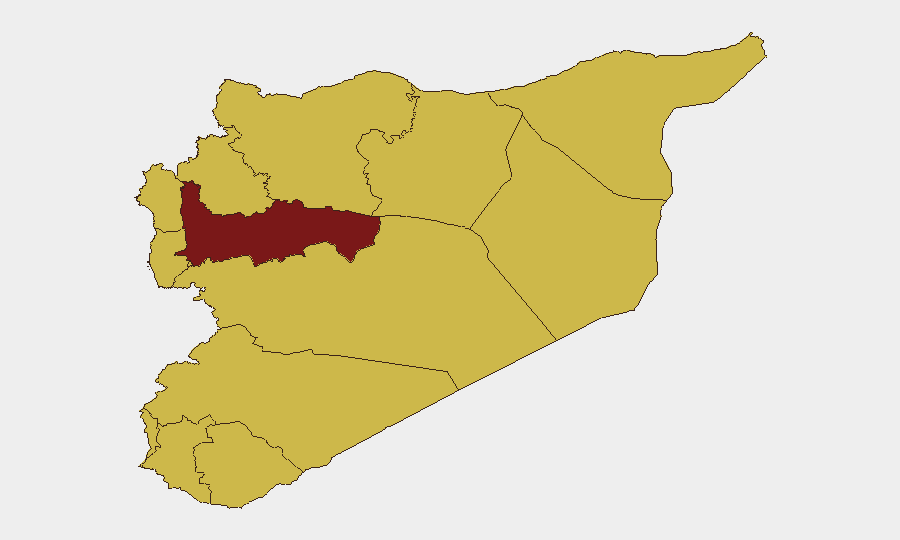
Hama Governorate (97.1) and Damascus Governorate (83.5) drive the composite threat score and warrant primary focus. Hama's elevation reflects sustained military activity and likely ongoing factional control disputes; Damascus risk reflects state security operations, detention activity, and law-enforcement intensity concentrated in the capital and surrounding Rif Dimashq. The coastal zone (Tartus, Lattakieh) and northern tier (Aleppo, Idleb) each register 67–70.8, indicating secondary conflict zones and cross-border movement; UNDOF-monitored Golan areas remain at equivalent risk due to external military activity and territorial sensitivity. Risk is distributed across multiple drivers—military operations, detentions, and unconventional violence—rather than concentrated in a single threat type.
How GeoBit Would Assist
Intel Sweep and multi-language OSINT fusion would rapidly corroborate the 18 July signals and extract missing incident details (location, actors, outcomes) from Arabic and international sources. AOI Monitoring with persistent alerting on Hama, Damascus, Aleppo, and Idleb would provide early warning of operational tempo changes, detention sweeps, or cross-border movement. Network and Actor Analysis would map detention networks and activist tracking, helping security teams assess exposure of local staff or contacts. Satellite and GIS analysis of Hama and Damascus would support damage assessment and territorial control mapping in real time.
7-Day Outlook
Military signaling and detention activity are expected to persist at current levels through late July; no escalation indicators are evident, but no de-escalation signals have emerged either. Regional actors (external military, aerospace assets) remain engaged, suggesting sustained external pressure. Security teams should assume operational volatility in Hama and Damascus will continue; cross-border movement and activist targeting warrant continuous monitoring.
Highest-Risk Areas — Ranked
| # | State / Region | Risk |
|---|---|---|
| 1 | Hama Governorate | 97.1 |
| 2 | Damascus Governorate | 83.5 |
| 3 | Tartus Governorate | 70.8 |
| 4 | Aleppo Governorate | 70.6 |
| 5 | Idleb Governorate | 67.6 |
| 6 | Lattakia Governorate | 67.1 |
| 7 | UNDOF | 67.1 |
| 8 | Al-Quneitra Governorate | 67.1 |
| 9 | Dar'a Governorate | 67.1 |
| 10 | Ar-Raqqa Governorate | 67.1 |
| 11 | Homs Governorate | 67.1 |
| 12 | Rif Dimashq Governorate | 67.1 |
Sources
Previous Daily Briefs
A new Syria brief is written every day — each with its own risk map and downloadable CSV. Here's the last week; use the calendar to go further back.
📅 Browse every day by calendar →
Highlighted days have a brief. Tap a day for that day's map & analysis, or “csv” for that day's dataset ($5).
Atlas — our AI intelligence desk — emails them this snapshot personally. Nothing else, no list.