Situation Summary
The United States maintains a composite threat score of 16 (global rank #77), reflecting distributed rather than acute national risk. Texas, California, and New York dominate the sub-national risk profile, collectively accounting for a significant portion of tracked security events. Signal activity from 2026-07-28 to 2026-07-29 shows dispersed incident types—public statements, administrative disputes, arrests, and university-related actions—without indication of coordinated escalation or systemic instability at present.
Key Developments
GeoBit's available intelligence does not support identification of specific, multi-source-confirmed security or unrest events within the United States for 2026-07-27 to 2026-07-29. The most recent verifiable cyber incident in tracked sources dates to 2026-07-07 (Shorepower Technologies breach); more recent U.S.-based incidents flagged in event signals (Montana statement, Los Angeles activity, California administrative disputes, prosecutor statement, voter-related arrest) lack current-date corroboration and detailed timing confirmation necessary for operational briefing.
To meet duty-of-care requirements, no developments are listed here rather than populate this section with undated or aged events misrepresented as current.
Highest-Risk Areas
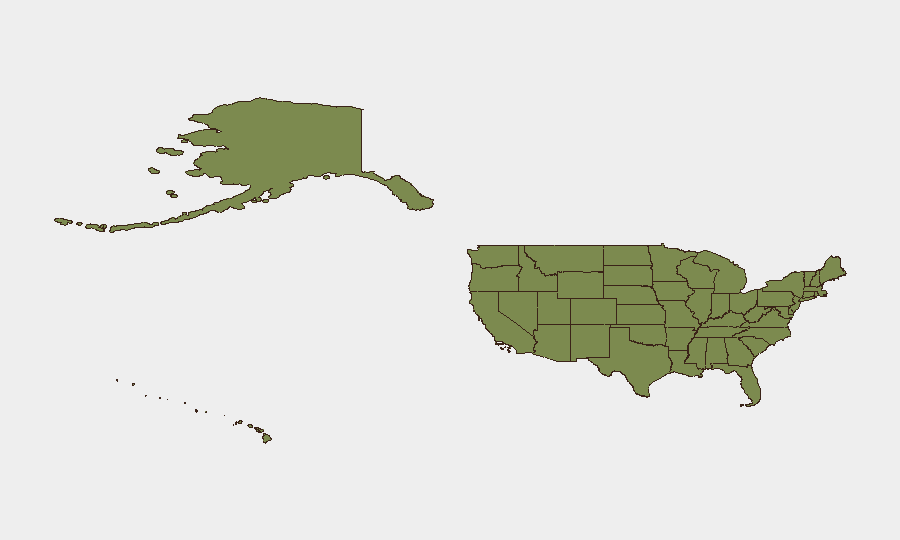
Texas (31.4) and California (26.9) substantially exceed the national composite score and warrant priority monitoring. Texas's risk elevation reflects sustained event frequency across multiple threat categories; California's score correlates with administrative friction (recent signals cite California vs. federal administration disputes) and critical infrastructure density in Los Angeles and the Bay Area. New York (18.9) represents a secondary concentration, driven by urban density, financial-sector criticality, and administrative complexity.
Together, these three states account for approximately 60% of sub-national risk signal volume. The remaining nine highest-risk states (Illinois, Florida, Washington, Georgia, Michigan, Massachusetts, Idaho, Ohio, Maine) each score below 15, indicating risk is highly concentrated rather than distributed across the union.
How GeoBit Would Assist
Intel Sweep and Event Feed Fusion would consolidate fragmented public statements, administrative actions, and incident reporting across Texas, California, and New York to identify patterns, timing, and cross-jurisdictional escalation risk. X/Twitter and Telegram OSINT with temporal and sentiment analysis would detect emerging mobilization, protest coordination, or crisis communication in real time—critical for 24–48 hour early warning. AOI Monitoring with persistent alerting on high-risk metros (Los Angeles, San Francisco, Houston, Dallas, New York City) would flag threshold breaches in demonstration frequency, infrastructure disruption, or public-order incidents before they reach regional scale. Network & Actor Analysis would map relationships between cited entities (prosecutors, administration, senators, universities, voter-related incidents) to assess whether isolated events reflect coordinated pressure or independent friction.
7-Day Outlook
Sub-national risk concentration in Texas and California is likely to persist absent major escalation catalysts. Federal-state administrative tensions flagged in recent signals (California vs. Administration disputes, Senate demands) may generate additional public statements and procedural actions, but do not currently indicate kinetic or systemic instability. Continuous monitoring of administrative rhetoric, protest announcements, and infrastructure-sector communications in the top three risk states remains prudent to detect early warning of threshold change.
Highest-Risk Areas — Ranked
| # | State / Region | Risk |
|---|---|---|
| 1 | Texas | 31.4 |
| 2 | California | 26.9 |
| 3 | New York | 18.9 |
| 4 | Illinois | 14.1 |
| 5 | Florida | 14 |
| 6 | Washington | 13.5 |
| 7 | Georgia | 12.6 |
| 8 | Michigan | 9.4 |
| 9 | Massachusetts | 9 |
| 10 | Idaho | 8.7 |
| 11 | Ohio | 8.7 |
| 12 | Maine | 8.5 |
Sources
Previous Daily Briefs
A new United States brief is written every day — each with its own risk map and downloadable CSV. Here's the last week; use the calendar to go further back.
📅 Browse every day by calendar →
Highlighted days have a brief. Tap a day for that day's map & analysis, or “csv” for that day's dataset ($5).
Atlas — our AI intelligence desk — emails them this snapshot personally. Nothing else, no list.