Situation Summary
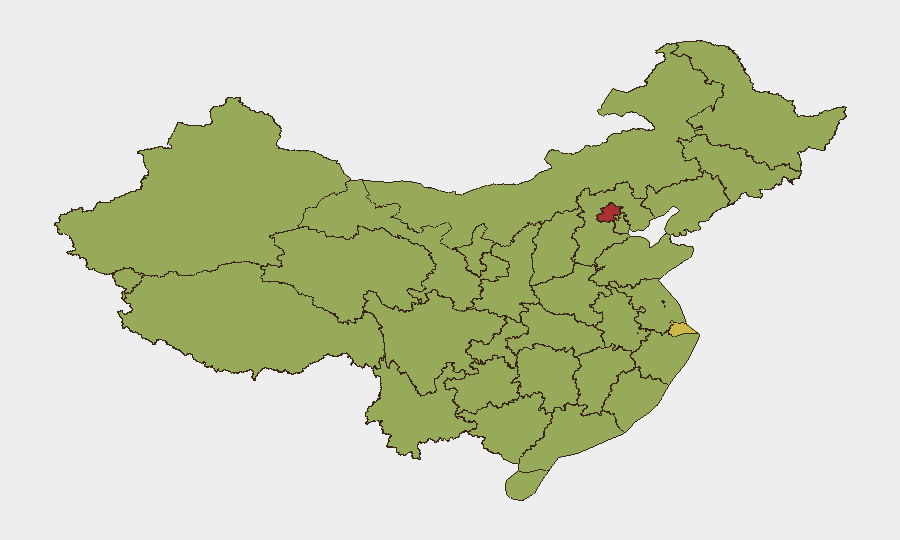
China's composite threat score of 70 (rank #19 globally) reflects structural political and military pressures rather than acute domestic unrest; open-source feeds confirm no significant protests, civil disorder, or major infrastructure failures in the last 24–48 hours. However, natural disasters—severe flooding in northern and southern regions, and a small-aircraft impact in Beijing's central business district on July 25—are creating localized safety and mobility disruptions. Beijing remains the highest-risk sub-national area (78.7), driven by political concentration and incident density rather than current civil instability.
Key Developments
- Beijing – Small aircraft crashed into central-business-district high-rise (July 25, 2026). Flight-tracking and witness reports confirmed impact into the city's tallest building, triggering evacuations and emergency response; short-term ground transport and airspace disruption in CBD zone remains likely.
- Northern China – Severe weather and flooding fatalities (July 25, 2026). State media reported five deaths from heavy rains across multiple northern provinces; ongoing moisture and secondary flood risk in affected watersheds.
- Southern China – Tropical storm impact (July 25, 2026). Uprooted trees and vehicle submersion reported; transport networks and outdoor infrastructure remain compromised.
- Nanning, Guangxi – Sustained flooding and search operations (ongoing since July 21–22). Record rainfall left four dead and eight missing; continued high water and infrastructure strain across the city and surrounding areas.
- Regional diplomatic friction (July 23–25). Multiple public statements and rejections from Philippine, South Korean, and Taiwanese sources regarding China-related issues; no acute physical incidents reported, but rhetorical escalation may signal medium-term posturing.
- Domestic regulatory activity (July 24). Ministry-level investigations and court rejections noted; routine governance activity without reported enforcement incidents or mass disruption.
Highest-Risk Areas
Beijing (78.7) leads the sub-national ranking due to political/administrative concentration and historical incident density. Shanghai (60.1), Guangdong (58.5), and coastal Zhejiang (54) follow, reflecting density, economic activity, and cross-border exposure. Inland and borderland provinces—Tibet (53.5), Heilongjiang (53), Jilin (52.5), and Gansu (52)—maintain elevated scores tied to structural governance sensitivity and geographic isolation. Current weather impacts affect northern (Heilongjiang, Jilin) and southern (Guangxi, Guangdong) zones; corporate teams in Beijing and Shanghai should anticipate transport delays and building-access changes near the crash site through late July.
How GeoBit Would Assist
AOI Monitoring & Early Warning with persistent geographic watches on Beijing CBD, Nanning, and flood-prone northern/southern corridors would detect escalating weather or infrastructure incidents in real time. Intel Sweep and multi-source OSINT fusion (X/Twitter, local news feeds, state media) provide 24–48-hour event confirmation and false-positive filtering—critical for distinguishing routine unrest signals from genuine operational risk. Routing & Network Analysis and GIS & Spatial mapping enable security teams to model alternative transport and supply-chain routes around disrupted zones, reducing exposure to congested or blocked corridors.
7-Day Outlook
Weather impacts in northern and southern provinces are expected to persist through late July; secondary flooding, mudslides, and transport disruption remain probable. Beijing CBD operations will gradually normalize as emergency response concludes, but short-term access restrictions may extend into early August. No escalation of civil unrest or geopolitical incidents is signaled; diplomatic messaging may intensify, but kinetic risk remains low absent major policy shocks.
Highest-Risk Areas — Ranked
| # | State / Region | Risk |
|---|---|---|
| 1 | Beijing | 78.7 |
| 2 | Shanghai | 60.1 |
| 3 | Guangdong Province | 58.5 |
| 4 | Zhejiang | 54 |
| 5 | Tibet | 53.5 |
| 6 | Heilongjiang | 53 |
| 7 | Jilin | 52.5 |
| 8 | Gansu | 52 |
| 9 | Henan | 51 |
| 10 | Sichuan | 50.5 |
| 11 | Fujian | 50.5 |
| 12 | Hubei | 50.4 |
Sources
Previous Daily Briefs
A new China brief is written every day — each with its own risk map and downloadable CSV. Here's the last week; use the calendar to go further back.
📅 Browse every day by calendar →
Highlighted days have a brief. Tap a day for that day's map & analysis, or “csv” for that day's dataset ($5).
Atlas — our AI intelligence desk — emails them this snapshot personally. Nothing else, no list.