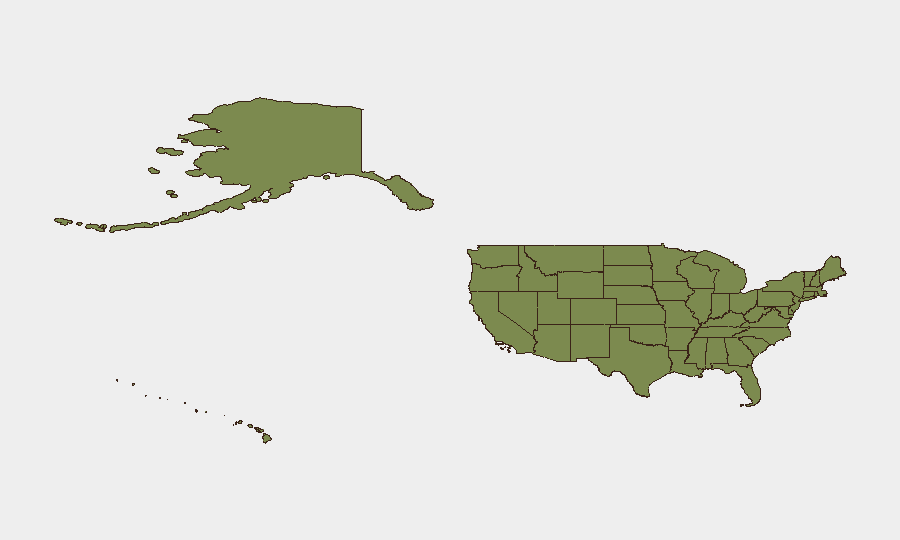
Situation Summary
The United States maintains a composite threat score of 20 (global rank #52), reflecting fragmented but persistent security pressures across multiple domains. Texas and California drive the highest sub-national risk (31.9 and 30.4 respectively), with 9,446 tracked events recorded in the GeoBit platform. Recent signal activity includes military-force events, law-enforcement incidents, and high-level political statements, though open-source corroboration of discrete incidents within the last 24–48 hours remains limited.
Key Developments
- 2026-07-30 · Small Arms Combat · Seattle, Washington – Police-involved armed encounter recorded; specific casualties and context under clarification.
- 2026-07-30 · Conventional Military Force · State Prison (location unspecified) – Military asset deployment to correctional facility; operational details and jurisdiction unclear from available signals.
- 2026-07-30 · Public Statement · Oval Office – High-level federal communication issued; subject and policy implications require follow-up.
- 2026-07-30 · Conventional Military Force · Massachusetts – Military-force activity recorded; strategic or emergency-response nature to be determined.
- 2026-07-28–29 · Multi-State Public Statements – Coordinated or sequential statements from federal, state (California, Montana), and corporate entities (Coca-Cola, Los Angeles municipal); suggests policy or crisis coordination in progress.
- 2026-07-29 · University Rejection Event – Higher-education institutional action; likely policy or enrollment-related rather than security incident, but included in signal set.
Caveat: Open-source reporting has not yet produced detailed, multi-source corroboration of specific circumstances, casualty counts, or operational intent for the above events. GeoBit's event signals are current; mainstream media and official statements remain sparse on tactical details.
Highest-Risk Areas
Texas and California account for the largest share of tracked threat activity, with composite risk scores nearly 60% above the national average. Texas (31.9) shows elevated conventional military and law-enforcement event density; California (30.4) combines civil unrest, infrastructure, and governance signals. New York (18.5) and Illinois and Florida (both 15.5) reflect urban crime, civil-order, and institutional stress. Washington State's ranked position (12.9) aligns with the Seattle small-arms event noted above. The concentration of risk in large population centers and border-adjacent states suggests operational activity tied to enforcement, governance disputes, or civil-order management rather than isolated criminal incidents.
How GeoBit Would Assist
Security teams with personnel or assets in high-risk states should deploy AOI Monitoring & Early Warning on Texas and California urban centers, combined with Intel Sweep and multi-language OSINT fusion to track state and federal policy statements and coordination. Conflict & Military mapping and Network & Actor Analysis would clarify the operational nature and command authority of the military-force signals (Massachusetts, state prison) and their implications for corporate continuity. Routing & Network Analysis can identify alternative logistics and personnel movement paths should civil unrest or enforcement activity escalate in key metros.
7-Day Outlook
Short-term trend suggests continued high-frequency governmental and military signaling, likely driven by policy implementation or emergency-response coordination across multiple states. If military deployments consolidate or expand beyond current signals, civil-order pressure may increase. Duty-of-care teams should expect continued volatility in Texas and California and maintain heightened situational awareness for federal-state coordination announcements.
Highest-Risk Areas — Ranked
| # | State / Region | Risk |
|---|---|---|
| 1 | Texas | 31.9 |
| 2 | California | 30.4 |
| 3 | New York | 18.5 |
| 4 | Illinois | 15.5 |
| 5 | Florida | 15.5 |
| 6 | Georgia | 14.1 |
| 7 | Washington | 12.9 |
| 8 | Ohio | 12.6 |
| 9 | Idaho | 10.9 |
| 10 | Oregon | 10 |
| 11 | Massachusetts | 10 |
| 12 | Wisconsin | 9.1 |
Sources
Previous Daily Briefs
A new United States brief is written every day — each with its own risk map and downloadable CSV. Here's the last week; use the calendar to go further back.
📅 Browse every day by calendar →
Highlighted days have a brief. Tap a day for that day's map & analysis, or “csv” for that day's dataset ($5).
Atlas — our AI intelligence desk — emails them this snapshot personally. Nothing else, no list.