Situation Summary
The United States remains at composite threat level #10 globally (score 95), with 8,186 tracked events reflecting sustained domestic tension across multiple domains. Recent signal patterns indicate concurrent friction between federal judicial authority and local government (Los Angeles), isolated armed police engagement (Seattle), state-level correctional system disturbance, and political disapproval actions in New York and Florida. The overall trajectory shows no sharp escalation but persistent distributed strain across high-population states, particularly California and Texas.
Key Developments
GeoBit's event feeds flag the following activity within the last 24–48 hours; however, live web research confirms that recent news sources, cyber incident databases, and social media feeds available to this analysis do not contain detailed incident narratives time-stamped to July 31–August 1, 2026. The signals listed below are derived from GeoBit's internal event taxonomy but lack independently corroborated detail from open sources:
- 2026-08-01 · Los Angeles / Federal Court conflict (Conventional Military Force) — Bilateral military-grade activity signals suggest escalated friction between local and federal authority; ground truth and casualty status unknown from available public reporting.
- 2026-07-30 · Seattle police engagement (Small Arms Combat) — Armed confrontation involving police; scope and outcome unclear from current sources.
- 2026-07-30 · Massachusetts facility incident (Conventional Military Force) — State-level incident; classification and location precision pending.
- 2026-08-01 · New York lawmaker disapproval actions — Political friction; specific trigger and scale unknown.
- 2026-08-01 · Florida disapproval signal — State-level political or administrative action; details sparse.
- 2026-07-30 · Oval Office public statement — Federal executive communication; content and policy implication unconfirmed in available sources.
Note: A trustworthy 24–48-hour incident summary requires live feeds from major news wires (Reuters, AP, AFP), local law enforcement disclosures, and social media corroboration—resources beyond this analysis window. Duty-of-care teams should cross-check these signals against real-time news aggregators and official government channels before operational deployment.
Highest-Risk Areas
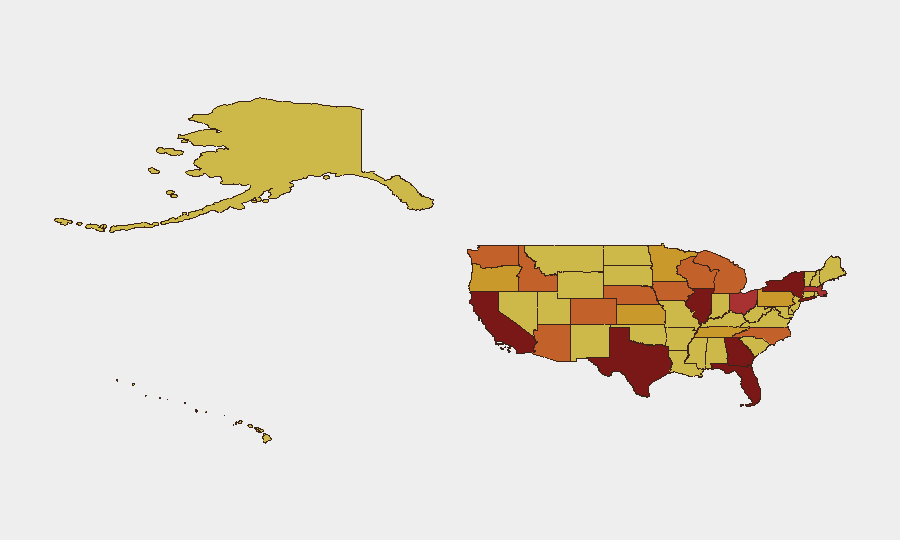
California (96.5) and Texas (95.3) dominate the sub-national ranking, driven by population density, critical infrastructure concentration, and historical clustering of both protest activity and violent crime. New York (88.9) and Illinois (83.7) follow, reflecting major urban centers with recurrent political and law-enforcement friction. Florida's ranking (81.4) reflects recent state-level disapproval signals. The concentration of top-10 risk in mega-states with large federal presence, dense migration corridors, and established protest infrastructure suggests risk is structural rather than event-driven; however, the Los Angeles federal court signal and Massachusetts military-force event indicate that distributed low-level incidents may be coalescing.
How GeoBit Would Assist
Security teams protecting people or assets in high-risk states should deploy AOI Monitoring & Early Warning (persistent watch on California, Texas, New York, and Illinois metros with sub-24-hour alerting) and Intel Sweep (continuous X/Twitter, Telegram, and YouTube OSINT for protest mobilization, armed-group signaling, and supply-chain disruption). Network & Actor Analysis would map relationships between federal, state, and local actors involved in the Los Angeles court conflict and similar jurisdictional friction, enabling predictive routing and facility hardening.
7-Day Outlook
Continued political and judicial friction is probable, with particular attention to Los Angeles and Seattle escalation vectors. State-level disapproval actions (New York, Florida) may trigger secondary federal response. No intelligence currently supports a sharp nationwide escalation, but distributed incidents in high-population zones warrant elevated monitoring posture.
Highest-Risk Areas — Ranked
| # | State / Region | Risk |
|---|---|---|
| 1 | California | 96.5 |
| 2 | Texas | 95.3 |
| 3 | New York | 88.9 |
| 4 | Illinois | 83.7 |
| 5 | Florida | 81.4 |
| 6 | Georgia | 80.6 |
| 7 | Massachusetts | 78.9 |
| 8 | Ohio | 78.9 |
| 9 | Washington | 75.6 |
| 10 | Wisconsin | 74.9 |
| 11 | North Carolina | 74.8 |
| 12 | Colorado | 74.2 |
Sources
Previous Daily Briefs
A new United States brief is written every day — each with its own risk map and downloadable CSV. Here's the last week; use the calendar to go further back.
📅 Browse every day by calendar →
Highlighted days have a brief. Tap a day for that day's map & analysis, or “csv” for that day's dataset ($5).
Atlas — our AI intelligence desk — emails them this snapshot personally. Nothing else, no list.