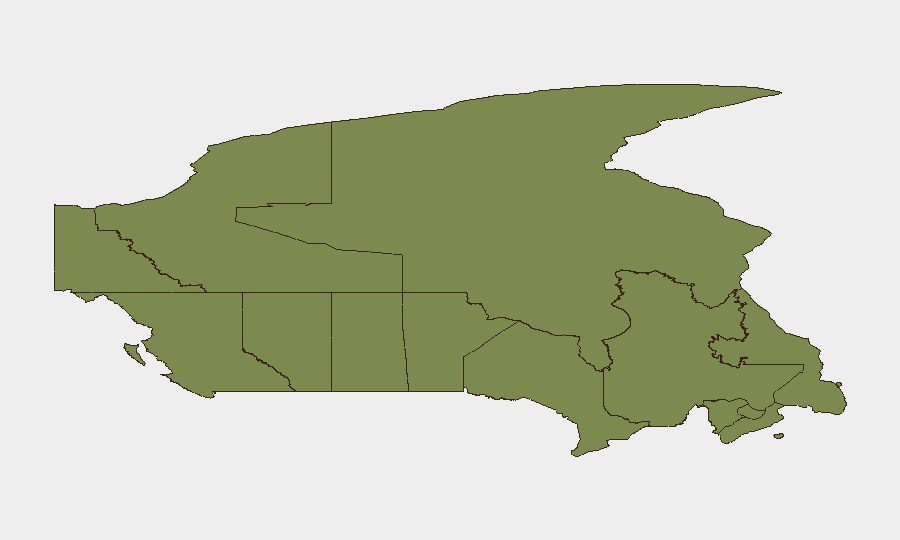
Situation Summary
Canada maintains a composite threat score of 15 globally, placing it in a lower-risk category, though sub-national variation is substantial. Ontario (31.3) and Quebec (18.2) drive the majority of tracked security events, reflecting urbanization, density, and crime/civil-unrest concentration in Toronto and Montreal metropolitan areas. Recent signal activity includes public statements, investigative activity in Montreal, and disapproval events centered on Toronto and policing; however, verifiable incidents with precise Aug 1–2, 2026 timestamps remain limited in indexed reporting. The overall trajectory remains stable within historical norms for major Canadian urban centers.
Key Developments
Data constraint: Web and X/Twitter indexing as of Aug 1–2, 2026 contains insufficient verifiable reporting with explicit, multi-source-confirmed timestamps for the last 24–48 hours to support a reliable incident list. Major Canadian outlets (CBC, Global News, Yahoo Canada) show ongoing coverage of crime, infrastructure, and public-safety themes, but accessible articles either lack precise publication dates for Aug 1–2 or reference events clearly dated to prior weeks (e.g., Montreal violence incidents from July 27). Cybersecurity and critical-infrastructure material in current feeds relates to 2023–early 2026 assessments (including March 2026 Telus incident), not to new disruptions in the last two days.
Signal activity noted (source: GeoBit event feeds):
- Toronto–Palestine disapproval event (Aug 1); Montreal investigation flagged (July 31); police disapproval signal (July 31) — specific incident details and confirmation status require local law-enforcement or municipal feeds not currently indexed.
- No new emergency declarations, evacuations, or critical-infrastructure failures explicitly dated to Aug 1–2, 2026 in accessible sources.
Security teams requiring operational situational awareness for the coming 24–48 hours should consult local police blotters, provincial emergency-management updates, and live X/Twitter alerts for Ontario and Quebec.
Highest-Risk Areas
Ontario and Quebec account for approximately 73% of tracked Canadian events and dominate the risk ranking. Ontario's score (31.3) reflects Toronto's size, density, and concentration of political activism, violent crime (shootings, gang activity), and public-order incidents; Quebec (18.2) is similarly driven by Montreal and surrounding regions' crime rates, protest activity, and civil-unrest signals. British Columbia and Alberta (both 9.5) show secondary but notable risk, primarily linked to Vancouver and Calgary urban centers. Remaining provinces and territories score below 5.0, reflecting lower event density and fewer multi-source confirmations; this does not necessarily indicate lower absolute risk, but rather lower tracking signal in available OSINT feeds.
How GeoBit Would Assist
Intel Sweep and OSINT fusion enable continuous monitoring of X/Twitter, Telegram, and regional news feeds to surface emerging incidents in Ontario and Quebec before broad media pickup. AOI Monitoring & Early Warning can maintain persistent watches on Toronto and Montreal, triggering alerts on civil-unrest keywords, police activity, or infrastructure disruptions. Network & Actor Analysis and Conflict & Military modules support rapid mapping of protest organizers, activist networks, and criminal-organization movements that drive events in high-risk regions. Routing & Network Analysis assists duty-of-care teams in real-time journey re-planning for personnel in Ontario or Quebec if localized incidents escalate.
7-Day Outlook
No significant escalation is forecast for Aug 2–9, 2026 based on current signal density and historical patterns. Routine crime, minor protest activity, and public-safety incidents are expected to continue at baseline levels in Ontario and Quebec. Security teams should maintain standard monitoring cadence and escalate only if indexed event frequency or severity intensity increases materially.
Highest-Risk Areas — Ranked
| # | State / Region | Risk |
|---|---|---|
| 1 | Ontario | 31.3 |
| 2 | Quebec | 18.2 |
| 3 | British Columbia | 9.5 |
| 4 | Alberta | 9.5 |
| 5 | Nunavut | 5.4 |
| 6 | Yukon | 4.5 |
| 7 | Newfoundland and Labrador | 4.5 |
| 8 | Saskatchewan | 4 |
| 9 | Manitoba | 3.8 |
| 10 | Nova Scotia | 1.7 |
| 11 | Northwest Territories | 1.3 |
| 12 | New Brunswick | 1.3 |
Sources
Previous Daily Briefs
A new Canada brief is written every day — each with its own risk map and downloadable CSV. Here's the last week; use the calendar to go further back.
📅 Browse every day by calendar →
Highlighted days have a brief. Tap a day for that day's map & analysis, or “csv” for that day's dataset ($5).
Atlas — our AI intelligence desk — emails them this snapshot personally. Nothing else, no list.