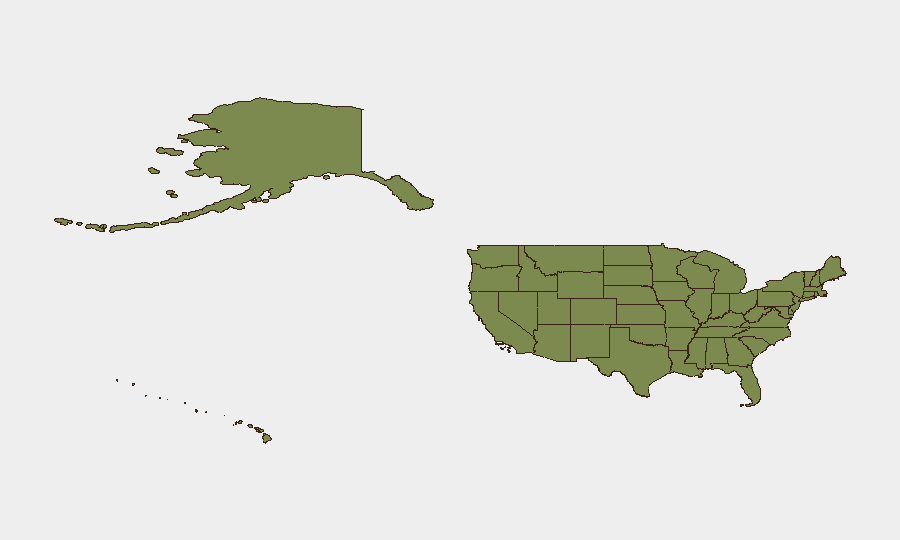
Situation Summary
The United States faces a sustained elevation in localized security incidents across multiple threat categories—active shooter events, civil unrest, transportation accidents, and infrastructure disruptions—concentrated in major metropolitan areas and politically sensitive regions. California, Texas, and New York account for the highest composite risk scores (32, 28.2, and 26.3 respectively), driven by the frequency and severity of reported events over the past 24–48 hours. The threat environment reflects no single coordinated campaign but rather a fragmented pattern of criminal violence, protest activity, and operational hazards that collectively raise duty-of-care exposure for corporate assets and personnel in high-density urban centers.
Key Developments
- Seattle, Washington – August 1: Mass shooting at Seattle Center food festival near Space Needle killed three and injured four around 6:00 PM; Seattle Police confirmed multiple victims and ongoing suspect search.
- Portland, Oregon – August 1: Escalated demonstrations in central Portland included street fires, storefront window damage, and confrontations with police; multiple arrests and temporary downtown transit disruption reported.
- Chicago, Illinois – August 1: Series of overnight shootings and armed carjackings on South Side resulted in multiple injuries and at least one fatality; police increased patrols and closed affected streets.
- New York City, New York – August 1: NYPD responded to shots-fired and armed robbery incident in Manhattan, prompting localized blockade and suspect search; no fatalities but significant police presence and brief area lockdowns.
- Atlanta, Georgia – August 1: Large unpermitted protest over policing and local political issues in downtown led to clashes with police, minor injuries, and arrests; crowd-control measures deployed.
- Los Angeles, California – August 1: High-speed pursuit ended in multi-car crash on West LA corridor, injuring several and blocking major arterial road for extended period.
- Houston, Texas – August 1: Hazardous materials truck accident on interstate caused lane closures and shelter-in-place advisories for nearby neighborhoods pending spill containment.
- Phoenix, Arizona – August 1: Power substation failure in metro area caused localized outages affecting traffic signals and public services into evening hours.
Highest-Risk Areas
California, Texas, and New York dominate the composite risk ranking and account for a significant share of recent tracked events. California's risk score of 32 reflects a combination of civil unrest activity, traffic-related incidents, and operational challenges in dense urban areas; Texas and New York show similar mixed-driver profiles spanning criminal violence, hazmat incidents, and localized civil disorder. The next tier—Georgia, Illinois, and Idaho—continues to show elevated exposure to armed violence and protest activity, particularly in metropolitan counties. Risk concentration in these jurisdictions reflects both population density and the prevalence of politically contentious environments and gang-related criminal activity.
How GeoBit Would Assist
Corporate security teams with personnel or assets in the identified high-risk states would leverage Intel Sweep and OSINT fusion to correlate real-time event feeds across law enforcement, social media, and local news to detect incident clustering and emerging patterns. AOI Monitoring & Early Warning with persistent geographic watches on corporate facilities, logistics corridors, and employee commute routes in California, Texas, New York, and Georgia would enable proactive alerts before incidents escalate or block access. Routing & Network Analysis would support rapid alternative-route planning for personnel and supply chains during active incidents, reducing exposure and operational disruption.
7-Day Outlook
The current elevated incident frequency—particularly clusters of armed violence in major metros and protest activity in politically sensitive regions—is likely to persist through the near term absent significant de-escalation. Corporate teams should anticipate continued localized disruptions to transportation, utilities, and public gathering spaces, with particular attention to the top-ranked California, Texas, and New York corridors.
Highest-Risk Areas — Ranked
| # | State / Region | Risk |
|---|---|---|
| 1 | California | 32 |
| 2 | Texas | 28.2 |
| 3 | New York | 26.3 |
| 4 | Georgia | 20.2 |
| 5 | Illinois | 18.6 |
| 6 | Idaho | 17.5 |
| 7 | Florida | 16.6 |
| 8 | Ohio | 14.8 |
| 9 | Massachusetts | 13 |
| 10 | Michigan | 11.1 |
| 11 | Washington | 10.5 |
| 12 | Oregon | 9.4 |
Sources
Previous Daily Briefs
A new United States brief is written every day — each with its own risk map and downloadable CSV. Here's the last week; use the calendar to go further back.
📅 Browse every day by calendar →
Highlighted days have a brief. Tap a day for that day's map & analysis, or “csv” for that day's dataset ($5).
Atlas — our AI intelligence desk — emails them this snapshot personally. Nothing else, no list.