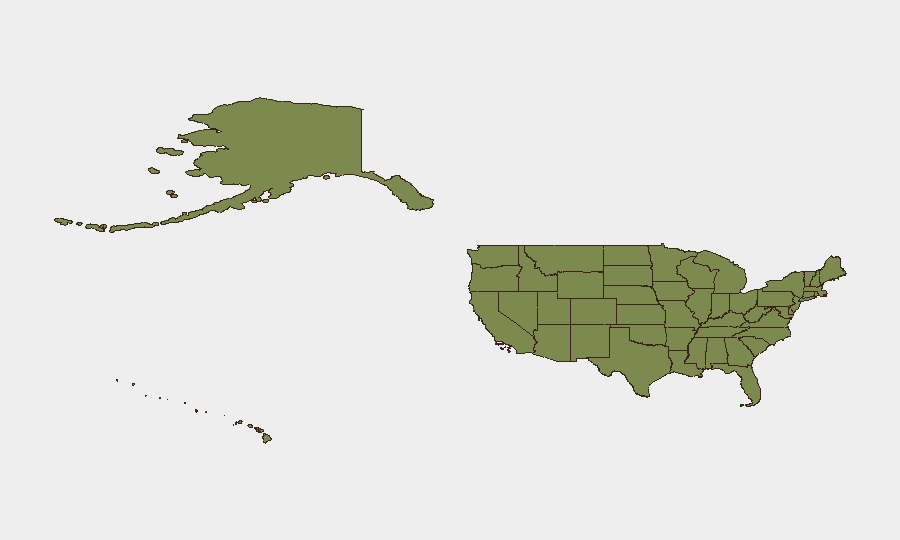
Situation Summary
The United States faces a composite security threat score of 11 (rank #97 globally), driven by escalating state-level instability, distributed cyber attacks on critical infrastructure, and localized violence. A coordinated multi-state cyberattack campaign targeting municipal water systems—with suspected Iranian state-actor involvement—marks a significant shift toward critical-infrastructure targeting. Conventional military-force signals in Oregon and California, combined with small-arms incidents and political disapproval signals in New York and Ohio, indicate fragmentation across multiple threat vectors rather than a single dominant crisis.
Key Developments
- Minnesota, Wisconsin, Michigan (July 31–August 1, 2026): Multi-state cyberattack campaign disrupted programmable logic controllers (PLCs) at 30+ community water systems; pro-Iran hacking group claimed responsibility; FBI opened federal probe for suspected Iranian state-actor involvement; some utilities issued boil-water notices and switched to manual operations. No water-quality compromise reported to date.
- Dearborn, Michigan (August 1, 2026): Active-shooter incident at mall resulted in 2 fatalities and 1 injury; local law enforcement responding and investigating.
- Houston, Texas (late July 2026): U.S. Immigration and Customs Enforcement officer shot and killed a suspect during vehicle-evasion attempt; use-of-force incident under review.
- Oregon (August 2, 2026): Conventional military-force signal detected; no further operational detail available.
- Los Angeles vs. Federal Court (August 1, 2026): Bidirectional conventional military-force signals indicate ongoing jurisdictional or operational tension between local and federal authorities.
- Ohio (August 3, 2026): Public-statement signal from state actor; concurrent disapproval signal toward federal government suggests political friction or policy dissent at state level.
- New York (August 1, 2026): Disapproval and public-statement signals directed at lawmaker(s); reflects local political or constituent pressure.
Highest-Risk Areas
Idaho and California lead the sub-national risk ranking (31.8 and 30.9 respectively), followed by New York (23). Idaho's elevated composite score likely reflects rural militia, extremist-movement, and border-stability factors; California's score combines metropolitan violence, state-federal jurisdictional strain (evidenced by August 1 military-force signals), and cyber-infrastructure exposure. New York's ranking reflects political polarization, activism intensity, and critical-infrastructure concentration. Texas (19.9) and Florida (14.1) show elevated but secondary risk, driven by border-security, migration, and localized violence factors.
How GeoBit Would Assist
Corporate security teams operating in high-risk states (Idaho, California, New York) should deploy GeoBit's Area-of-Interest (AOI) Monitoring & Early Warning to track persistent emerging threats in real time across county and municipal jurisdictions. Network & Actor Analysis and OSINT fusion capabilities enable rapid attribution and tracking of state-sponsored cyber actors targeting critical infrastructure (water systems, energy, communications) and early detection of supply-chain or operational-continuity risks to corporate assets. Conflict & Military mapping combined with Intelligence Sweep and multi-language OSINT (including Telegram and X monitoring) provide situational awareness of jurisdictional friction, militia activity, and protest mobilization in highest-risk regions.
7-Day Outlook
Water-system cyber-incident investigation and remediation will likely dominate federal and state agency focus through early August; secondary incidents or copycat attacks on energy or transportation infrastructure carry elevated probability. State-level political friction (Ohio, New York) and military-force signals (Oregon, California) suggest risk of escalation if federal-state coordination or resource-allocation disputes intensify. Small-arms violence and isolated incidents will likely persist at current regional baseline absent rapid policy or enforcement shifts.
Highest-Risk Areas — Ranked
| # | State / Region | Risk |
|---|---|---|
| 1 | Idaho | 31.8 |
| 2 | California | 30.9 |
| 3 | New York | 23 |
| 4 | Texas | 19.9 |
| 5 | Florida | 14.1 |
| 6 | Washington | 12.3 |
| 7 | Ohio | 11.5 |
| 8 | Georgia | 10.7 |
| 9 | Oregon | 10.1 |
| 10 | Massachusetts | 10.1 |
| 11 | Illinois | 10 |
| 12 | Michigan | 9.2 |
Sources
Previous Daily Briefs
A new United States brief is written every day — each with its own risk map and downloadable CSV. Here's the last week; use the calendar to go further back.
📅 Browse every day by calendar →
Highlighted days have a brief. Tap a day for that day's map & analysis, or “csv” for that day's dataset ($5).
Atlas — our AI intelligence desk — emails them this snapshot personally. Nothing else, no list.